Generation of Dendritic Cells from Peripheral Monocytes

describe the imagePBMCs are not just a source of many different circulating immune cell types, but also a source of potential cells that one can generate in vitro. One excellent and long-standing example of this is the generation of dendritic cells (DCs) from monocytes.  Monocyte derived DCs (mDCs) are an excellent tool for researchers to do immunological assays requiring a source of professional antigen presenting cells (APCs). While circulating B cells are capable of antigen presentation and T cell activation, they do not offer the robust response that DCs do. The generation of mDCs is a relatively simple protocol that anyone can do with just a source of PBMCs, a few important cytokines, and, of course, some media and incubator space. After this protocol, you will have obtained immature mDCs that can then be matured for use as APCs in your assay.

The first step in generating mDCs is to decide how you would like to isolate the monocyte population from your PBMCs, which serve as your precursor cells for DCs. The easiest and cheapest way is to simply plate your PBMCs on a cell culture dish and let the inherent qualities of monocytes go to work. Monocytes are unique amongst other PBMC cells in their tendency to stick to plastic. An incubation period between 1-24 hours will allow your monocytes to adhere to the dish and let you gently wash off any other PBMCs. The alternative to the adherence method for isolating monocytes is to use a magnetic antibody based technology of your choice. Several companies, such as Miltenyi Biotec, Life Technologies, and Stem Cell Technologies, offer excellent kits for this. While the adherence method is cheaper, antibody based kits give you higher monocyte recovery and purity, which may or may not matter depending on your downstream assays.

Once you have your monocytes isolated from your PBMCs, you can begin the 7 day culture to generate mDCs. Monocytes can be plated in a standard cell culture media along with two important cytokines, GM-CSF and IL-4 (50ng/mL and 100ng/mL). GM-CSF will push the monocytes down a DC differentiation pathway. IL-4 will inhibit the monocytes from differentiating into macrophages, thereby insuring they become DCs. Continue the culture for 6-8 days and be sure to refresh your cytokines every other day.

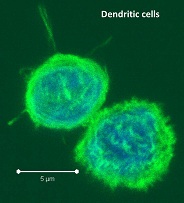
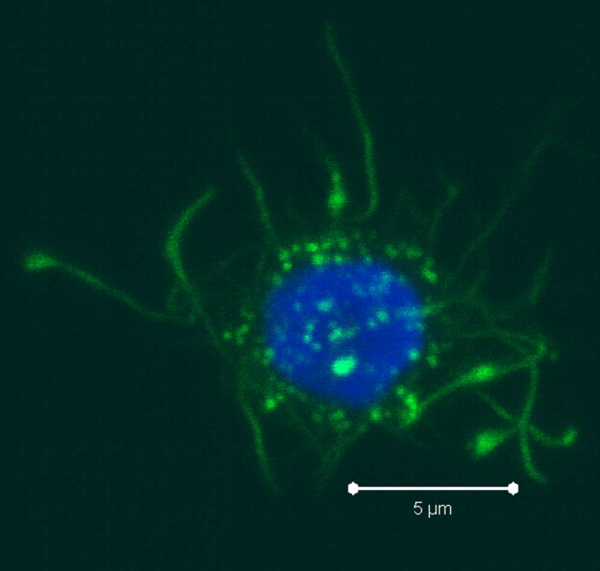
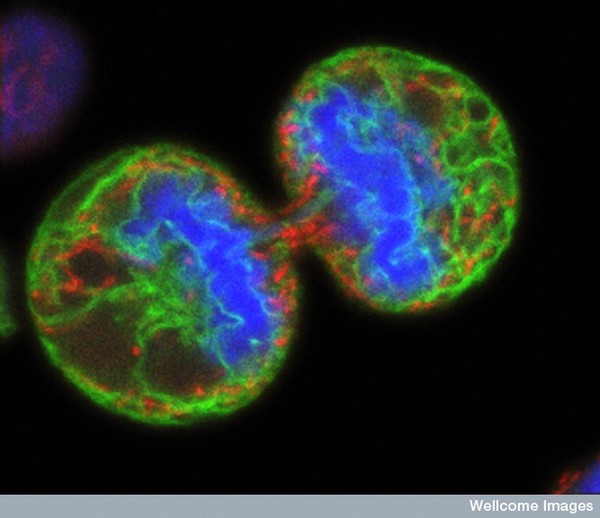
As the monocytes differentiate over the culture period, note their progress by examining them with your tissue culture room microscope. The cells should appear as fairly round and are generally 2-3 times the size of lymphocytes. It is important to note that the mDCs will not appear like the elongated cartoon DCs with long extensions you see in text books. Those DC characteristics are generally only found in tissues and not in vitro.  While you may see some cells that resemble this, those are more likely to be somewhat of a natural stromal layer, made up of cells including macrophages, that the monocyte culture develops to support cell growth. In fact, the immature mDCs will have very few if any, cytoplasmic protrusions.

DC2 resized 600Once the culture period has finished, between 6-8 days, the mDCs can be collected. The exact day is not critical, as long as you remain consistent in the day you pick for your following experiments. To collect the mDCs, gently wash the culture dishes with several streams of media by pipetting up and down. The mDCs, which are currently immature, will be somewhat floating and only loosely adherent. Because of their loose adherence, they require several rounds of gentle pipetting, but do not require cell scraping, EDTA, or trypsin treatment. Note that the culture dishes will still contain some adherent cells. Do not worry about these cells, since these are not the loosely adherent DCs we are interested in.

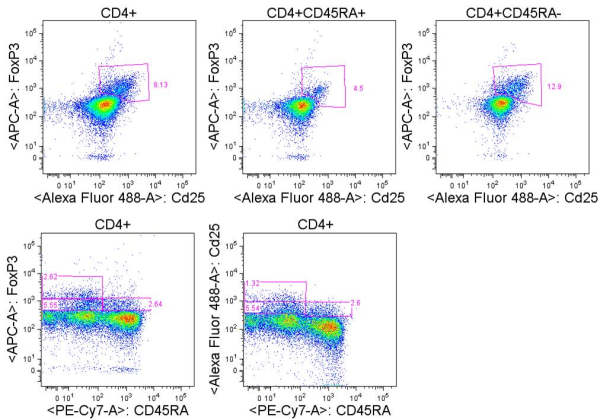
After completion of these steps, you should have a nice population of immature mDCs, which express CD11c, CD1c, and are CD123-. In my next post, I will cover some tips and tricks for analyzing these cells by flow cytometry. Importantly, I will also cover ways to mature the immature mDCs for use as APCs.

Colt EgelstonColt Egelston is currently a post-doctoral fellow at the Beckman Research Institute of the City of Hope, in Duarte, CA. He received his Ph.D. from Rush University in Chicago and is interested in all things immunology.


Human PBMC T cell immediate early activation markers: What are they and what do they do?

melanoma dividing cellsThere are many strategies for assessing the function of T cells from human peripheral blood mononuclear cells (PBMC).  T cells that have recently been activated through their T cell receptor (TCR) will express a series of activation markers at different time points following activation.   Activation markers include receptors such as chemokine and cytokine receptors, adhesion molecules, co-stimulatory molecules, and MHC-class II proteins.  Some of these molecules have established functions in T cell biology, while the relevance or function of others remains elusive.  Flow cytometry is the method of choice for evaluating various types of surface or intracellular markers that indicate the activation status of T cells.  However, what are these markers, what is their function in T cell biology, what T cell populations will express them, and when can they be assessed are key questions to address when deciding which markers are best for a given assay and question of interest.

In this article, the first of a short series, I will discuss two of the most commonly used immediate early activation markers for assessing the activation status of human PBMC T cells: CD69 and CD40L.

Immediate Early Activation Markers:

CD69 (AIM, Leu23, MLR3) is a signaling membrane glycoprotein involved in inducing T cell proliferation. CD69 is expressed at very low levels on resting CD4+ or CD8+ T cells in PBMC (<5-10%), and is one of the earliest assessable activation markers, being rapidly upregulated on CD4+ or CD8+ T cells within 1 hour of TCR stimulation or other T cell activators such as phorbol esters via a protein kinase C (PKC) dependant pathway.  Expression of CD69 peaks by 16-24 hours and then declines, being barely detectable 72 hours after the stimulus has been withdrawn.

The inability to upregulate CD69 following TCR activation may be associated with T cell dysfunction.  For instance, Critchley-Thorne et. al, showed that PBMC T cells from metastatic melanoma patients with lower responsiveness to interferons had reduced CD69 upregulation compared with healthy controls, and this corresponded with multiple other functional defects in T cells from these patients.  Thus CD69 expression may be a measure of T cell dysfunction in human disease.

CD40L (CD154) is a member of the TNF-receptor superfamily that functions as a co-stimulatory molecule by binding CD40 which is constitutively expressed on antigen presenting cells (APCs).  The CD40L-CD40 ligation results in the activation of multiple downstream pathways including the MAPK (JNK, p38, ERK1/2), NF-ĸB, and STAT3 transcription factors.  CD40L expression is quickly upregulated within 1-2 hours after TCR stimulation via the transcription factors NFAT and AP-1.  CD40L expression peaks near 6 hours after stimulation, and declines by 16-24hrs. CD40L expression however is biphasic, and the addition of anti-CD28 or IL-2 along with TCR stimulation leads to sustained expression for several days (Snyder et. al., 2007).

Expression of CD40L on resting PBMC CD4+ or CD8+ T cells from healthy donors is very low (<1%).  However this percentage has been shown to be significantly increased on up to 17% of CD4+ T cells and 21% of CD8+ T cells in patients with active SLE, and these differences between healthy and SLE patients were also seen following anti-CD3 stimulation of PBMCs (Desai-Mehta, et. al, 1996).  The review below by Daoussis et. al, discusses the role of CD40L expression in several other human diseases.

In summary, CD69 and CD40L are both rapidly induced following T cell activation and both exert important functions in T cell biology. Expressions of these markers have both been shown to be altered in various human diseases.  Understanding the biology of T cell activation markers will allow for the best application of these markers to specific experimental questions and assay types.


Additional Reading:

Multiparametric flow cytometric analysis of the kinetics of surface molecule expression after polyclonal activation of human peripheral blood T lymphocytes. Biselli R, Matricardi PM, D’Amelio R, Fattorossi A. Scand J Immunol. 1992 Apr;35(4):439-47.

Surface markers of lymphocyte activation and markers of cell proliferation.  Shipkova M, Wieland E.  Clin Chim Acta. 2012 Sep 8;413(17-18):1338-49.

Flow cytometric analysis of activation markers on stimulated T cells and their correlation with cell proliferation.  Caruso A, Licenziati S, Corulli M, Canaris AD, De Francesco MA, Fiorentini S, Peroni L, Fallacara F, Dima F, Balsari A, Turano A.   Cytometry. 1997 Jan 1;27(1):71-6.

T cell activation via Leu-23 (CD69).  Testi R, Phillips JH, Lanier LL. J Immunol. 1989 Aug 15;143(4):1123-8.

A whole-blood assay for qualitative and semiquantitative measurements of CD69 surface expression on CD4 and CD8 T lymphocytes using flow cytometry.  Lim LC, Fiordalisi MN, Mantell JL, Schmitz JL, Folds JD. Clin Diagn Lab Immunol. 1998 May;5(3):392-8.

Utility of flow cytometric detection of CD69 expression as a rapid method for determining poly- and oligoclonal lymphocyte activation.  P E Simms and T M Ellis.  Clin Diagn Lab Immunol. 1996 May; 3(3): 301–304.

Down-regulation of the interferon signaling pathway in T lymphocytes from patients with metastatic melanoma.  Critchley-Thorne RJ, Yan N, Nacu S, Weber J, Holmes SP, Lee PP. PLoS Med. 2007 May;4(5):e176.

Direct inhibition of CD40L expression can contribute to the clinical efficacy of daclizumab independently of its effects on cell division and Th1/Th2 cytokine production.  Snyder JT, Shen J, Azmi H, Hou J, Fowler DH, Ragheb JA. Blood. 2007 Jun 15;109(12):5399-406.

Targeting CD40L: a Promising Therapeutic Approach.  D. Daoussis, A.P. Andonopoulos, and S. C. Liossis. Clin Diagn Lab Immunol. 2004 July; 11(4): 635–641.

Hyperexpression of CD40 ligand by B and T cells in human lupus and its role in pathogenic autoantibody production. J. Clin. Investig. 97:2063-2073. Desai-Mehta, A., L. Liangjun, R. Ramsey-Goldman, and S. Datta. 1996.

Photo credit: wellcome images / Foter.com / CC BY-NC-ND

Weird but common T cell populations in human PBMC

Human T cells are generally analyzed for expression of CD4 and CD8 to classify them as either of these two major classes of effector T cells.  But flow cytometry analysis of PBMCs stained with antibodies targeting CD3, CD4, and CD8 reveals several other populations with varying expression of these three markers.  So what are they?

For the sake of this discussion, I will refer to the largest typical single positive populations of CD3+CD4+ and CD3+CD8+ T cells as CD4high and CD8 high, respectively.

These are some other T cell populations that have been observed in human PBMC:

CD8lowCD4high (1): Populations of CD4 T cells that express CD8.  This population is likely heterogeneous, and compared with the CD4high population, includes a higher proportion of effector memory and terminally differentiated effector CD4 T cells that have re-expressed CD8.  CD8 is expressed as a heterodimer of either α/α, α/β, or β/β, and this population has been noted to be primarily CD8α/α.  Work by Zloza et. al, identified that up to 50% of these cells can be NKT cells, including invariant CD3+6B11+ NKT cells and non-invariant CD3+CD16/56+ NKT cells.  Of note, NKT cells may also be present at low frequencies in CD4+CD8+, CD4CD8, CD4 or CD8 single positive populations.

CD4lowCD8high (2): Populations of CD8+ T cells, of the primarily CD8α/β type that express CD4.   This population can be further subdivided into two groups:  CD4dimCD8high and CD4medCD8high.  Studies have shown that expression of CD4 on these CD8+ T cells is functional and inducible by stimulations such as anti-CD3/CD28.   These cells express markers of activated T cells and exhibit a higher frequency of memory cells (CD45RA) as compared with typical CD8high cells.

CD8low (3): These cells express CD8 at lower levels compared with CD8 high populations, are negative for CD4 expression, and can express higher levels of CD3.  Trautmann et. al, describe the frequency of CD8 low cells as being from 0.2%-7% of CD8 T cells in healthy donors and described these cells as populations of oligoclonal cytotoxic terminally differentiated effector CD8 T cells (CD45RA+CD62L).

WeirdCD3CD4CD8 Tcell Populations resized 600

CD4neg CD8neg CD3high (4):  CD4 and CD8 double negative cells that express high levels of CD3 compared with CD4 high and CD8 high populations.  This fraction has been shown to contain largely the TCRγ/δ T cell subset although γ/δ T cells can express and the CD8α and/or the CD8β chains.

CD4neg CD8neg CD3pos (5): This fraction has been shown to largely contain heterogeneously differentiated TCRα/β T cell subsets including regulatory T cells.  The expression of CD3 on this subset is lower than that of the CD4neg CD8neg CD3high subset containing γ/δ T cells, although γ/δ T cells may be present in this population as well.

An important thing to note is that characterizations of these populations are generalizations and individuals have been shown to have aberrant profiles compared with these.  Other populations have been described such as CD4high CD8high double positive cells which may be primarily effector memory T cells but here I have focused on those populations I see most frequently.   In summary, careful gating and analyses of each of these populations is necessary, as these are not only functionally unique subsets, but each population appears to be heterogeneous and also contain varying percentages of NKT cells.


Further Reading:

CD4(+)CD8(dim) T lymphocytes exhibit enhanced cytokine expression, proliferation and cytotoxic activity in response to HCMV and HIV-1 antigens.  Suni MA, Ghanekar SA, Houck DW, Maecker HT, Wormsley SB, Picker LJ, Moss RB, Maino VC. Eur J Immunol. 2001 Aug;31(8):2512-20.

Multiple populations of T lymphocytes are distinguished by the level of CD4 and CD8 coexpression and require individual consideration.  Zloza A. and Al-Harthi, L. Journal of Leukocyte BiologyJ Leukoc Biol. 2006 Jan;79(1):4-6.

Characterization of circulating CD4+ CD8+ lymphocytes in healthy individuals prompted by identification of a blood donor with a markedly elevated level of CD4+ CD8+ lymphocytes.  Prince HE, Golding J, York J. Clin Diagn Lab Immunol. 1994 Sep;1(5):597-605.

Upregulation of CD4 on CD8+ T cells: CD4dimCD8bright T cells constitute an activated phenotype of CD8+ T cells. Sullivan YB, Landay AL, Zack JA, Kitchen SG, Al-Harthi L. Immunology. 2001;103: 270-280.

Human CD8 T cells of the peripheral blood contain a low CD8 expressing cytotoxic/effector subpopulation.  Trautmann A, Rückert B, Schmid-Grendelmeier P, Niederer E, Bröcker EB, Blaser K, Akdis CA. Immunology. 2003 Mar;108(3):305-12.

CD3 bright lymphocyte population reveal gammadelta T cells.  Lambert C, Genin C. Cytometry B Clin Cytom. 2004 Sep;61(1):45-53.

Isolation and characterization of human antigen-specific TCR alpha beta+ CD4(-)CD8- double-negative regulatory T cells.  Fischer K, Voelkl S, Heymann J, Przybylski GK, Mondal K, Laumer M, Kunz-Schughart L, Schmidt CA, Andreesen R, Mackensen A. Blood. 2005 Apr 1;105(7):2828-35.

Distinct CD4+ CD8+ double-positive T cells in the blood and liver of patients during chronic hepatitis B and C. Nascimbeni M, Pol S, Saunier B. PLoS One. 2011;6(5):e20145.

CD4+ CD8+ double positive (DP) T cells in health and disease.  Parel Y, Chizzolini C. Autoimmun Rev. 2004 Mar;3(3):215-20.

High Throughput Systems for Maximizing Human PBMC Assay Potential

Humans are a heterogeneous population and studies comparing populations of humans require a high number of samples for statistical validity.  In addition, human samples such as PBMC are precious in that they represent the immune state of an individual at a point in time.  Thus, when studies are done to analyze a particular state of the immune response in individuals, such as pre- versus post-vaccination, or along the course of a disease state, once used, the samples can never be replaced.  To make the most of human PBMC samples, in particular when patient samples are being used, it is important to not only carefully optimize assays, but additionally be able to maximize the questions that can be addressed with these samples.

Having recently completed a large study involving human patient PBMCs, I encourage the use of high throughput assays systems that allow for a streamlined experimental approach.  All of these assays involve 96-well plate based methods and commercially available kits.


Basic Equipment for 96-well Plate Assays:

Multichannel Pipettes are necessary for quickly performing all 96-well plate assays.  These come in p1000, p200, p20, and p2 volumes.

96 well plate96-well Plates:  Different types of 96-well plates are available for different assay types.  There are various surface coatings including tissue-culture treated polystyrene for cell cultures, uncoated, and others.  Plates can have various plate bottom geometries and optical characteristics.  For instance there are black plates available for light-sensitive assays.  For protocols involving volumes larger then 250ul, there are deep-well plates that carry a 2ml volume per well.

VPscientific multichannelMultichannel Vacuums: Companies such as V&P Scientific offer a multitude of multichannel vacuum manifolds that fit plates of different depths for removing supernatant from wells via vacuum apparatus.  Often these will be the proper length such that they don’t touch the well bottom and work well with removing buffers from centrifuged PBMC cell cultures, such as during washing steps for flow-cytometry.

http://www.vp-scientific.com/wands_&_manifolds.php


PBMC subset Purification:  For magnetic bead based purification of PBMC populations of interest, Stem Cell Technologies offers a 96-well plate EasyPlate™ EasySep™ Magnet that allows separation of up to 1 x 10⁷ cells per well.  Currently only negative or untouched cell isolation methods are supported by this magnetic system due to the larger size of the magnetic beads used in Stem Cell Technologies’ negative isolation kits compared with positive isolation kits.

http://www.stemcell.com/en/Products/All-Products/EasyPlate-EasySep-Magnet.aspx


RNA Isolation:  Qiagen offers two kits for 96-well purification of total RNA from cells.  The RNeasy 96 Kit and RNeasy Plus 96 Kit.  These are 96-well column based platforms which require either a Qiagen vacuum manifold or specialized centrifuge for the protocol.  The RNeasy 96 Kit and RNeasy Plus 96 Kit are similar with the RNeasy Plus 96 Kit utilizing an extra set of steps and columns for elimination of genomic DNA.  The standard RNeasy 96 Kit protocol does however have an optional step for on-column DNAse digestion, however DNAse is not included in the kit.

RNeasy 96 Kit: http://www.qiagen.com/products/rnastabilizationpurification/rneasysystem/rneasy96.aspx

RNeasy Plus 96 Kit:http://www.qiagen.com/products/rneasyplus96kit.aspx


RNA Quantification is much easier if done by 96-well methods than one sample at a time.  Life Technologies’ Quant-iT™ RiboGreen® RNA Assay Kit is extremely sensitive but requires a fluorescence-plate reader.  Thermo Scientific now has a NanoDrop 8000 UV-Vis Spectrophotometer that quantifies nucleic acid concentrations from 96-well plates.

http://products.invitrogen.com/ivgn/product/R11490

http://www.nanodrop.com/productnd8000overview.aspx


In summary, systematic high-throughput protocols can be developed using 96-well systems such as these and many others.  Thus, numerous PBMC samples can be put through multiple experimental procedures in a streamlined manner, maximizing efficiency and minimizing experimental variation.  In this way, multiple questions can easily be simultaneously addressed in precious PBMC samples.

Markers for Identification of Regulatory T cells in Human PBMC

Forkhead box P3 (FoxP3)+ CD4+ T cells, known as regulatory T cells or TREGs, are a class of negative regulatory T cells that function to suppress immune responses, thereby establishing tolerance, preventing autoimmunity, and allowing tumor escapes from immune surveillance.   TREGs are thought to be generated by two major mechanisms.  Natural TREGs are generated through positive selection in the thymus via differential TCR signaling compared with conventional T cells.  Adaptive or converted TREGs are thought be generated in the periphery by conversion of conventional CD4+ T cells via various mechanisms.

TREGs are a heterogeneous population of T cells that function via cell-contact dependent and independent mechanisms to suppress various immune cell types.  Contact-dependent mechanisms of suppression include expression of negative regulatory receptors such as CTLA4, or killing of associated dendritic cells (DCs) through secretion of perforin and granzyme B.  Contact-independant mechanisms of suppression include TREGs secretion of immune suppressive cytokines including IL-10 and TGFb.   High expression of the IL-2 co-receptor CD25 allows TREGs to act as a sink for IL-2 thereby leading to IL-2 deprivation of conventional T cells and inhibition of proliferation.

TREGs are thus an important class of cells and study of these cell populations in human PBMC requires an understanding of the surface and intracellular markers that can be used for flow cytometry analysis and isolation by Fluorescence-activated cell sorting (FACS) or other methods.

Miyara et. al. identified three functionally unique FoxP3+ populations in  freshly isolated CD4+ T cells from human PBMC.  These three populations could be identified by flow cytometry staining of CD45RA, FoxP3, and CD25.  CD25 and FoxP3 expression were highly correlated in the CD4+ population, and I have consistently seen this in my own analyses of unstimulated human PBMC.  The three populations included CD45RA+FoxP3low cells which were CD25++, CD45RAFoxP3high cells which were CD25+++, and CD45RAFoxP3low cells which were CD25 ++.  When these populations were FACS sorted based on CD45RA and CD25 expression, only CD45RA+CD25++ and CD45RACD25+++ cells were functionally suppressive in co-culture experiments with TCR-activated CD25CD45RA+CD4+ responder T cells.  Thus CD45RA+FoxP3lowCD25++ cells and CD45RAFoxP3highCD25+++ cells were denoted as naïve/resting and effector/activated TREGs, respectively.  CD45RAFoxP3low cells in contrast, are likely a heterogeneous mixture of cells and include some cells able to produce IFNg, IL-17, and IL-2 upon PMA+ ionomycin stimulation.  Because dividing effector T cells are able to transiently express FoxP3 at low levels, these cells are likely to be contained in the CD45RAFoxP3low population.  Thus, when using CD25 or FoxP3 to identify TREGs by flow cytometry, CD45RA should be included, and care must be taken with the gating strategies.

Treg Identification FoxP3 CD25 CD45RA resized 600

CD25 in combination with TNFR2 and/or the lack of expression of CD127 have been shown to identify FoxP3+ TREGs that are highly suppressive even in CD25low populations and thus may be excellent markers in particular for FACS sorting of TREGs for functional analyses wherein FoxP3 cannot be utilized as a selection marker.

Several other markers have been used to delineate different populations of TREGs.  The intracellular inhibitory receptor CTLA4, the co-stimulatory receptor ICOS, and the MHC class II cell surface receptor HLA-DR, are co-expressed with FoxP3 in the CD45RAFoxP3high TREG population and may be utilized as specific markers of that population.

Depending on the assay conditions, additional markers may be used to identify TREGs.  LAP, CD121a, and CD121b have been noted as highly specific markers of TREGs but are not expressed in the resting state, becoming transiently induced under assay conditions utilizing TCR stimulation.

This is by no means an exhaustive list of markers that have been used to identify human TREGs in their various functional subsets and states.  The 2011 review in Int Immunopharmacol. by Chen et. al. discusses the usage of these and other markers including CCR6, LAG-3, GARP, CD103, CD39, and CD49d.

In summary, there are multiple combinations of markers that can be used to identify functionally different TREG populations within human PBMC.  The selection of these markers should be considered in the context of the assay type being done and the questions being asked about these heterogeneous populations of cells.

Further Reading:

Regulatory T cells: mechanisms of differentiation and function.  Josefowicz SZ, Lu LF, Rudensky AY.  Annu Rev Immunol. 2012;30:531-64.

Foxp3+ regulatory T cells: differentiation, specification, subphenotypes.  Feuerer M, Hill JA, Mathis D, Benoist C. Nat Immunol. 2009 Jul;10(7):689-95.

Functional delineation and differentiation dynamics of human CD4+ T cells expressing the FoxP3 transcription factor.  Miyara M, Yoshioka Y, Kitoh A, Shima T, Wing K, Niwa A, Parizot C, Taflin C, Heike T, Valeyre D, Mathian A, Nakahata T, Yamaguchi T, Nomura T, Ono M, Amoura Z, Gorochov G, Sakaguchi S.  Immunity. 2009 Jun 19;30(6):899-911.

Resolving the identity myth: key markers of functional CD4+FoxP3+ regulatory T cells.  Chen X, Oppenheim JJ. Int Immunopharmacol. 2011 Oct;11(10):1489-96.

A peripheral circulating compartment of natural naive CD4 Tregs. D. Valmori, A. Merlo, N.E. Souleimanian, C.S. Hesdorffer, M. Ayyoub.  J. Clin. Invest., 115 (2005), pp. 1953–1962.

Activation-induced FOXP3 in human T effector cells does not suppress proliferation or cytokine production.  Allan SE, Crome SQ, Crellin NK, Passerini L, Steiner TS, Bacchetta R, Roncarolo MG, Levings MK. Int Immunol. 2007 Apr;19(4):345-54.

CD127 expression inversely correlates with FoxP3 and suppressive function of human CD4+ T reg cells.   W. Liu, A.L. Putnam, Z. Xu-Yu, G.L. Szot, M.R. Lee, S. Zhu, P.A. Gottlieb, P. Kapranov, T.R. Gingeras, B. Fazekas de St Groth et al.  J. Exp. Med., 203 (2006), pp. 1701–1711

Co-expression of TNFR2 and CD25 identifies more of the functional CD4+FOXP3+ regulatory T cells in human peripheral blood.  Chen X, Subleski JJ, Hamano R, Howard OM, Wiltrout RH, Oppenheim JJ.  Eur J Immunol. 2010 Apr;40(4):1099-106.

Using Phospho-Flow Cytometry to Study Signaling in Human PBMCs

One thing that every immunologist agrees on is that immune cells are heterogeneous, and human peripheral blood mononuclear cells (PBMC) contain many different immune cell types.  CD4+ T cells alone exist in dozens of uniquely functioning subsets.  Receptor mediated signal transduction events in response to signals such as cytokines, chemokines, various receptor ligands, and engagement of the T cell or B cell receptors represent an important aspect of immune cell communication and the many types of immune cells present in human PBMC are differentiated by these responses.  Trying to derive mechanisms from averages of complex PBMC populations obscures the understanding of the relationships that occur between expression of proteins and signaling states in unique cell populations and on the single cell level.

Dr. Gary Nolan and colleagues pioneered a method using flow cytometry to look at cell signaling in single cells using antibodies targeting phosphorylated protein sites, termed phospho-flow cytometry or “phosflow”.  In phosflow, PBMCs or other cell populations are stimulated with signaling receptor ligands and/or antagonists for a period of time.  Then the cells are fixed using paraformaldehyde-based buffers to lock the cells in their induced states of phosphorylation.  The cells are then permeabilized and stained with fluorescently-labeled antibodies against the phosphorylated proteins, antigens to identify cell populations, and other proteins of interest, and analyzed on a flow cytometer.

Using this method, our lab has assessed the response to many cytokines by analyzing phosphorylation of the STAT family of transcription factors, as well as phosphorylation events that occur downstream from T cell receptor (TCR) and B cell receptor (BCR) engagement, and Toll-like receptor ligation, such as NF-kB (p65), ERK, p38, and ZAP70BD Biosciences is a key resource for many of the reagents needed to perform these assays, providing several different buffers and antibodies against many important signaling targets.

LPS Monocytes p38 Phosflow resized 600

There are several considerations for optimizing this protocol.  The first is selecting the proper permeabilization method.  Nolan and colleagues published a protocol in which 100% methanol is used for permeabilization following fixation, and this is the method I have used most frequently.  One key advantage with this method is that following methanol permeabilization, the cells can be stored for an extended period of time at -20ºC or -80ºC prior to staining with the antibodies and running the flow cytometry.  Thus, many samples can be stimulated on different days, but the flow cytometry analysis can be performed later in a large batch, in order to limit the variability between staining intensities that can otherwise occur between experiments.  This is very important because when analyzing phosflow data, the fluorescence intensities which translate to magnitude of the phosphorylation of the protein target is often the key factor being analyzed, although the percentage of cells able to respond to a given signal can also be an important parameter for analysis.  However, there are a number of commercially available buffer sets for these assays which should be selected based on the phospho-proteins and other antigens of interest.

Another important factor to consider when setting up these assays is selection of the target antigens for identifying cell populations of interestSome antigens do not survive permeabilization with some of these reagents, including methanol.  For instance, I have had poor luck trying to identify B cells using CD19 or monocytes using CD14. CD20 and CD33 have been used respectively as alternatives that work well with methanol.

Cytobank, an online resource dedicated to phosflow created by Gary Nolan’s lab, is great for assisting in selecting the proper antigens and antibody clones for phosflow.  This website lists antibodies, including the phospho-target antibodies, that have been successfully and unsuccessfully tested with BD Biosciences’ various permeabilization buffers.

In summary, phosflow is an excellent method for analyzing signal transduction events in complex cell populations.  Using single cell assays for studies on protein expression and signaling will drive our understanding of the immune system’s complexity to the next level.


Nolan lab Phosflow protocol:

Single-cell phospho-protein analysis by flow cytometry. Schulz KR, Danna EA, Krutzik PO, Nolan GP.Curr Protoc Immunol. 2012 Feb;Chapter 8:Unit 8.17.1-20.


BD Biosciences Phosflow Homepage:

http://www.bdbiosciences.com/research/phosflow/index.jsp?WT.ac=FP_Phosflow


Cytobank’s list of antibodies tested with various permeabilization buffers:

http://www.cytobank.org/facselect/


Further Reading:

Flow cytometric analysis of cell signaling proteins. Suni MA, Maino VC.  Methods Mol Biol. 2011;717:155-69.

Single-cell, phosphoepitope-specific analysis demonstrates cell type- and pathway-specific dysregulation of Jak/STAT and MAPK signaling associated with in vivo human immunodeficiency virus type 1 infection.  Lee AW, Sharp ER, O’Mahony A, Rosenberg MG, Israelski DM, Nolan GP, Nixon DF. J Virol. 2008 Apr;82(7):3702-12.


Identification of CD4+ TH1, TH2, and TH17 populations in human PBMC

T cells present in human peripheral blood mononuclear cells (PBMC) are complex populations of different subtypes with unique functions.  CD4+ and CD8+ T cells are most simply classified as naïve, central memory, effector memory, and terminally differentiated effector subtypes, and T cells are currently thought to differentiate along this progression path following antigen experience.  In a previous post, I discussed using CD3, CD4, CD8, CD45RA or CD45RO, and CCR7 or CD62L as markers for differentiating T cells into these subtypes by multiparametric flow cytometry.

In addition, CD4+ T cells can be even further characterized as to their specific functions.  The cytokine milieu present during T cell activation through the T cell receptor (TCR) guides T cells to differentiate into memory and effector T helper subtypes (TH) including TH1, TH2, and TH17 subsets, all of which are present in PBMC.

Each of these TH subtypes functions by expressing a unique set of cytokines and chemokine receptors in order to elicit specific responses in different tissue settings.  It is important to note that memory T cells maintain flexibility in their functionality and can be re-polarized into different subtypes if re-stimulated under an alternate TH inducing condition.

Using multiparametric flow cytometry, each of these TH subsets can be identified by expression of specific cytokines, transcription factors, and surface markers including chemokine receptors, although the various markers used in the literature to classify the same subset do not overlap entirely. Identification of TH subsets by surface markers simply requires surface staining and is the easiest assay to perform.  Transcription factor expression can be assessed, which requires intracellular/nuclear permeabilization protocols such as BD Biosciences’ FoxP3 Buffer Set.  Finally, intracellular cytokine production can be detected following TCR stimulation with anti-CD3 and anti-CD28 antibodies or the combination of Phorbol 12-Myristate 13-Acetate (PMA) and the Ca2+ ionophore, ionomycin.  This generally requires 4-6 hours of stimulation in the presence of protein transport inhibitors: either brefeldin A or monensin, which are optimal for different cytokines.

TH1 cells promote cellular immunity against viruses and intracellular bacteria.  TH1 cells have been characterized in many ways.  Production of IFNg following TCR stimulation is probably the most common and direct functional representation to assess TH1 in PBMC.   Alternatively, the expression of the chemokine receptors CXCR3 and CCR5 have been associated with TH1 but not TH2 or TH17 cells.  The transcription factor T-bet (TBX21) is the major factor regulating TH1 differentiation and is also a marker of TH1 cells that can be assessed by flow cytometry, although T-bet expression is promiscuous and can be expressed in TH17 cells.  Interestingly, expression of any of these markers may not overlap entirely with IFNg expression.  For instance, in central memory T cells, CXCR3+ cells are considered pre-TH1 cells and do not express IFNg, while in the effector memory population, a fraction of CCR5+ and CXCR3+ cells express IFNg.  As always, care must be taken when making comparisons between percentiles and functions of populations identified using different markers.

TH2 cells are the CD4 helper subtype that promotes immunity against extracellular pathogens and are involved in allergic inflammation.  TH2 cells in PBMC can be classified by production of TH2-specific cytokines including IL-4, IL-5, and IL-13 following TCR stimulation or PMA/ionomycin.  However, expression of these cytokines can be difficult to detect and expression of the surface receptors CRTH2, CCR4, or CCR3 are alternatives.  Again, expression of CRTH2, CCR4, or CCR3 does not mark all existing IL-4, IL-5, and IL-13 expressing TH2 cells and vice versa, although CRTH2 has been demonstrated to be quite effective.

TH17 cells are known as the subtype associated with inflammatory autoimmune diseases and protection from fungal infections.  TH17 cells are classified by expression of IL-17 or surface marker expression, being CCR6+CCR4+.   Expression of the TH17-specific transcription factor RORg/gt can also be assessed.  A fraction of IL-17 expressing cells can also express IFNg and TH17 associated markers CCR6 and RORg/gt. Some have even suggested that IL-17+IFNg+ cells are a transitional state when more plastic TH17 cells differentiate into effector TH1 cells.

As cytokine expression may be the most discrete method of describing a TH cell regarding its function, I have used cytokine expression as a measure of TH1 and TH17 cells in human PBMC.  However in the case of TH2 cells, expression of IL-4 and IL-13 was hard to detect by flow cytometry, even with PMA and ionomycin stimulation and thus I have instead utilized CRTH2.  The protocol that I have optimized for identification of TH1, TH2, and TH17 cells involves a 4 hour stimulation of PBMCs with anti-CD3 and anti-CD28 antibodies or with PMA + ionomycin in the presence brefeldin A.  Following this, I first stain for surface markers including CRTH2 to identify TH2 cells.  Then the cells are fixed and permeabilized using BD Biosciences’ Cytofix Cytoperm buffer set and stained for IFNg (TH1) and IL-17 (TH17).  Using this method I have never seen co-expression for any of these factors with the exception of a small population of cells that co-stain with IFNg and IL-17, as commonly described in the literature.

CD4 TH1 TH2 TH17  human PBMC resized 600

Taken together, selection of markers for assessing these populations must be done carefully, bearing in mind that cytokines characteristic of a TH subtype are not always co-expressed in all cells identified as that TH subtype by the surface markers and transcription factors discussed here.  Flow cytometry panels containing markers for all of these TH subtypes can allow measurement of more specific TH populations from PBMC by gating based on specific expression as well as exclusion of the other TH subtype markers.


Additional Reading

Heterogeneity of CD4+ memory T cells: functional modules for tailored immunity.  Sallusto F, Lanzavecchia A. Eur J Immunol. 2009 Aug;39(8):2076-82.

Chemokine receptor expression identifies Pre-T helper (Th)1, Pre-Th2, and nonpolarized cells among human CD4+ central memory T cells.  Rivino L, Messi M, Jarrossay D, Lanzavecchia A, Sallusto F, Geginat J. J Exp Med. 2004 Sep 20;200(6):725-35.

Human T cells that are able to produce IL-17 express the chemokine receptor CCR6.  Singh SP, Zhang HH, Foley JF, Hedrick MN, Farber JM. J Immunol. 2008 Jan 1;180(1):214-21.

Selective expression of a novel surface molecule by human Th2 cells in vivo.  Nagata K, Tanaka K, Ogawa K, Kemmotsu K, Imai T, Yoshie O, Abe H, Tada K, Nakamura M, Sugamura K, Takano S. J Immunol. 1999 Feb 1;162(3):1278-86.

Tricks for analyzing PBMC populations by flow cytometry

Flow cytometry allows assessment of protein expression on a single cell level.  Because of the diversity of populations comprising peripheral blood mononuclear cells (PBMC), flow cytometry represents the best method for studying the functional and phenotypic properties of these cell subsets.  There have been a number of publications that present multiparametric flow cytometry staining panels for assessing PBMC populations, and as an easy first step into these assays, these panels can be referenced (see a few examples below).

However, use of these established panels may not suit further exploratory questions, and thus an understanding of the best methods for designing flow cytometry panels is needed.  Because of the many identified populations and the upper limits of markers that can be simultaneously used in flow cytometry, a lot of thought must go into planning these assays.

Flow cytometry utilizes fluorophore-conjugated antibodies targeting antigens of interest.  Antigenic markers uniquely present on PBMC population subsets have been actively sought after by the immunology community. The upper limit of the number of markers that can be simultaneously assessed depends on several parameters.  Most obviously, this depends on the specs of the flow cytometer instrument available.  I presently use a modified version of the BD LSR Fortessa, with five lasers, and allowing detection of up to 17 parameters plus forward and side scatter.

Unfortunately, because of overlap in the excitation and emission spectrums of available fluorophores, this doesn’t mean that I am able to successfully co-analyze 17 PBMC markers.  The fluorescence emitted from a given fluorophore may be detected or “spill over” into the range of detectors optimized for other fluorophores.  Although flow cytometry software is capable of calculating the percent spillover from this spectral overlap and subtracting this estimated fluorescence from the affected channels by a process known as compensation, this is not a perfect science. Due to spectral overlap, there are a few points to consider when designing an antibody “staining panel” for your immunological assessments.

First, select the fluorophores you hope to use in your panel.  To do this, determine the laser and detector configurations of your cytometer.  This will tell you for which fluorophores the excitation and emission spectrums are optimal on your instrument.

Next, choose detection channels to try first based on minimal excitation and emissions overlap.  Alternatively, consult previously published panels to see which fluorophore combinations have been recommended.  As an example, for my instrument’s 561nm laser, there are 5 detectors, so if I had to choose 3 of these, it would simply be every-other one based on the detector’s spectral range.  However, fluorophores can overlap in not only their emission but also their excitation spectrums.  Thus, it is important to look across the detectors for different lasers.  For instance on my instrument, there is a 780/60BP detector on the 561nm laser for detection of PE-Cy7, and the same detector on the 640nm laser for detection of APC-Cy7.   Thus the use of these channels together may be complicated if the fluorophores have a wide excitation range.  BD Biosciences has an awesome fluorescence spectrum viewer for envisioning the spill-over between parameters based on your cytometer configurations.  Other companies such as Life Technologies, eBioscience, and Biolegend also have similar tools to reference for fluorophores not sold by BD Biosciences.

It is important to mention that fluorophores are improving all the time.  Newer chemistries have led to development of product lines such as the Brilliant Violet dye series and Q-Dots with highly improved excitation and emissions spectrums for minimal spill-over.  Thus, for each channel, there could be several fluorophores that fit the optimal excitation and emission properties but select the one with optimal qualities of not only brightness but also their excitation and emission spectrums.

Once you have selected a likely handful of combinable fluorophores, it is time to figure out which cellular markers to target with which fluorophores.  To do this, first determine which markers of interest in your staining panel are co-expressed.  If there is no co-expression of your selected markers, it becomes easier to utilize antibodies tagged with spectrally overlapping fluorophores.  For instance, Pacific Blue and V500 have an approximately 10-20% spillover into the other’s channel on my LSR Fortessa’s configurations.  However, when not co-expressed, for instance CD4 and CD8, the fluorescent spill-over and hence compensation issues between these fluorophores are minimized, i.e. if there is no expression of Pacific Blue, then there is nothing to subtract from the V500 channel and vice versa.  However, if markers are co-expressed, such as CD4 and CD45RA, then issues with compensation between these parameters may lead to over or under-subtraction of fluorescence values in CD4+CD45RA+ populations compared with single positive populations.  But if your objective is only to gate these populations for analysis of other markers or to determine population percentages, then markers such as these may be successfully utilized together if these populations are visually discernible on cytometry data plots.  Another key thing to mention is for the lower expressing antigens, choose the brightest fluorophores.

But we’re not finished yet.  Next, determine for which markers your objective is to gain information about fluorescence intensity.  Now take the example from above but imagine that your question involved the magnitude of CD45RA expression on the CD4 versus CD8 population of PBMC T cells.  I have not done this example directly, but I can imagine that having high levels of compensation between one but not another parameter (in this case between CD4 and CD45RA but not between CD8 and CD45RA), may lead to inaccuracies in the relative fluorescence intensities.   Thus, in this example, if CD45RA is the marker for which expression intensity is the question, then the overlapping spectral fluorophores Pacific Blue and V500 would be best suited for identifying CD4 and CD8, while a fluorophore with minimal compensation issues with these channels, such as PE, would be best for CD45RA.  Thus, for markers in which determining fluorescence intensity is your objective, choose fluorophores with the least spectral overlap with all of the others in your panel.

PBMCAnalysisByFlowCytometryCD3CD4CD20 resized 600

Finally here’s another trick:  you can use two exclusively expressed markers in the same channel, as long as there is a third marker to differentiate these populations.  For example, I have very successfully used CD4-PerCP-Cy5.5 (CD4+ T cells) together with CD20-PerCP-Cy5.5 (B cells) along with CD3-V450 to differentiate the T cells from B cells in human PBMC.  In this case, CD4+ T cells will be double positive in V450 and PerCP-Cy5.5 channels, while CD20+ B cells will be PerCP-Cy5.5+ but V450, and CD8+ T cells will be PerCP-Cy5.5 and V450+.

In summary, multiparametric flow cytometry analysis of PBMCs can be tricky, but with these and other tricks up your sleeve it becomes much easier to successfully design panels optimal for the questions you are asking and to maximize the number of parameters in your flow cytometry staining panels.


Examples of established multiparametric flow cytometry panels:

Standardizing immunophenotyping for the Human Immunology Project.  Maecker HT, McCoy JP, Nussenblatt R.  Nat Rev Immunol. 2012 Feb 17;12(3):191-200.

Multiparameter flow cytometry monitoring of T cell responses.  Maecker HT.  Methods Mol Biol. 2009;485:375-91.

11-color, 13-parameter flow cytometry: identification of human naive T cells by phenotype, function, and T-cell receptor diversity.  De Rosa SC, Herzenberg LA, Herzenberg LA, Roederer M. Nat Med. 2001 Feb;7(2):245-8.

Nine-color flow cytometry for accurate measurement of T cell subsets and cytokine responses. Part I: Panel design by an empiric approach. McLaughlin BE, Baumgarth N, Bigos M, Roederer M, De Rosa SC, Altman JD, Nixon DF, Ottinger J, Oxford C, Evans TG, Asmuth DM. Cytometry A. 2008 May;73(5):400-10.


BD Bioscience’s Fluorescence Spectrum Viewer:

http://www.bdbiosciences.com/research/multicolor/spectrum_viewer/index.jsp

Basic markers of T cell populations in human PBMC

Human peripheral blood mononuclear cells (PBMC) are comprised of complex populations of T cells, B cells, NK cells, monocytes, and dendritic cells.  In addition, there are more complicated cell types such as NKT cells that are thought of as T cells that share many properties of NK cells.  Within all of these basic populations are many functionally unique subsets.  Because of the diversity of populations in PBMC, flow cytometry represents the best method for studying functional and phenotypic properties of these cell subsets.  In the next few blog posts, I will discuss selection of markers for studying PBMC populations using flow cytometry and the best way to arrange these markers in flow cytometry staining panels.

The PBMC cell type I have the most experience with characterizing is T cells.  CD3, a T cell specific marker, is necessary to differentiate T cells from other populations, simply because CD4 and CD8 can be expressed by other cell types.  CD8 can be expressed on NK cells, while CD4 can be expressed on populations of monocytes and dendritic cells.  CD4 and CD8 are also necessary markers for identification of these two major T cell populations.

CD4 and CD8 T cells are most simply classified as naïve or antigen experienced populations including central memory, effector memory and effectors.  Central memory and effector memory populations are known to differ in their effector functions and ability to home to different anatomical sites.  Two markers are necessary to differentiate naive, central memory, effector memory and effector T cell populations present in PBMC.

The first is CD45, a protein tyrosine phosphatase regulating src-family kinases, is expressed on all hematopoietic cells.  CD45 can be expressed as one of several isoforms by alternative splicing of exons that comprise the extracellular domain. CD45RA is expressed on naïve T cells, as well as the effector cells in both CD4 and CD8.  After antigen experience, central and effector memory T cells gain expression of CD45RO and lose expression of CD45RA.  Thus either CD45RA or CD45RO is used to generally differentiate the naïve from memory populations.

However, differentiation between central and effector memory populations and between naïve and effector populations can be achieved by adding a second marker.   There are several markers that have been used for this purpose and these tend to mark these populations at slightly different stages of the differentiation pathway that is thought to occur in T cells as they change from central to effector memory cells.  The chemokine receptor CCR7 is considered the gold standard for this discrimination, and the lymph node homing receptor CD62L is a close second choice.  Naïve and central memory cells express these receptors in order to migrate to secondary lymphoid organs, while the absence of these receptors allows for effector memory and effector cells to accumulate in peripheral tissues.  CCR7 has been classically thought to be difficult to stain for due to low expression levels, and as a result I have never used it.  However, a recent review article pointed out that a new brighter staining antibody to CCR7 has been developed (clone 150503), and is something I hope to test in the near future.  CD62L has generally been my marker of choice, however CD62L expression is lost following density gradient centrifugation, cryopreservation, TCR ligation or activation with PMA/ionomycin.  Thus CD62L as a marker is best utilized following overnight culturing subsequent to thawing cryopreserved cells.  Other potential markers are CD27 and CD28 which are also more highly expressed by the central memory and naive populations.  However, it is important to note that each of these markers, CCR7, CD62L, CD27, and CD28, marks slightly different populations of cells and care must be taken when making comparisons between populations defined by different markers for assessing frequencies or functions.

In summary, naïve T cells are CD45RA+CD45ROCCR7+CD62L+, central memory T cells are CD45RACD45RO+CCR7+CD62L+, effector memory T cells are CD45RACD45RO+CCR7CD62L, and effector cells are CD45RA+CD45ROCCR7CD62L.  Thus, CD3, CD4, CD8, CD45RA or CD45RO, and CCR7 or CD62L or CD27, are a great starting point for designing flow cytometry panels for the assessment of T cells present in human PBMC.  T cells populations, however, are much more complex, and may be further classified by helper subtypes and activation status, which will be discussed in a later blog.

describe the image

The use of CD45RA and CD62L to differentiate naive, central memory, effector memory and effector T cell populations present in PBMC.  Naïve CD4 and CD8 T cells are CD45RA+CD45ROCCR7+CD62L+ (B, F), central memory T cells are CD45RA- CD45RACD45RO+CCR7+CD62L+ (A, E), effector memory T cells are CD45RACD45RO+CCR7CD62L (C, G), and effector cells are CD45RA+CD45ROCCR7CD62L (D, H).


Further Reading:

Central memory and effector memory T cell subsets: function, generation, and maintenance.   Sallusto F, Geginat J, Lanzavecchia A. Annu Rev Immunol. 2004;22:745-63.

Types of immune cells present in human PBMC

When peripheral whole blood is drawn for human immune system studies, it is often processed to remove red blood cells by density gradient centrifugation. Most commonly this method uses Ficoll Paque, a solution of high molecular weight sucrose polymers, a product of GE Healthcare Ltd.  Ficoll separates whole blood into two fractions above and below the density of 1.077g/ml.

Peripheral blood mononuclear cells (PBMC) are the populations of immune cells that remain at the less dense, upper interface of the Ficoll layer, often referred to as the buffy coat and are the cells collected when the  Ficoll fractionation method is used.

Erythrocytes (red blood cells) and polymorphonuclear cells (PMNs) which include neutrophils and eosinophils are generally removed during this fractionation as they are denser then 1.077g/ml.  Basophils, however can be greater or less dense then 1.077g/ml and thus may be present to a small degree in the less dense PBMC fraction.

PBMCs include lymphocytes (T cellsB cells, and NK cells), monocytes, and dendritic cells.  In humans, the frequencies of these populations vary across individuals.  In my experience as well as that of others, lymphocytes are typically in the range of 70 – 90% of PBMCs, monocytes range from 10 – 30% of PBMCs, while dendritic cells are rare, being only 1 – 2% of PBMCs.  The frequencies of cell types within the lymphocyte population include 70 – 85% CD3+ T cells (45 – 70% of PBMC), 5 – 20% B cells (up to 15% of PBMC), and 5 – 20% NK cells (up to 15% of PBMC).

The CD3+ compartment is composed of CD4 (25 – 60% of PBMC) and CD8 T cells (5 – 30% of PBMC), in a roughly 2:1 ratio.  Both CD4 and CD8 T cells can be further subsetted into naïve, and the antigen-experienced central memory, effector memory, and effector subtypes that exist in resting or activated states.  Multiple markers can be used to identify these compartments to varying similarities and thus the frequencies reported by people using different markers may vary.

CD4 T cells are known as helper T cells and can be further classified into various functional subtypes based on the expression profiles of specific cytokines, surface markers, or transcription factors.  These include regulatory T cells, TH1, TH2, and TH17 cells as well as other described subpopulations such as TH9, follicular helper, and TR1 types.  These classifications however will certainly become more complex in the future, as recently the cytotoxic CD8 T cell compartment has been to shown to be extremely heterogenous in marker expression and function and may be comprised of roughly 200 functional phenotypes.

Dendritic cells 2

Circulating B cells include transitional, naïve, and memory subtypes as well as plasmablasts, all of which can be found at varying populations in peripheral blood.  Circulating dendritic cells include plasmacytoid dendritic cells as well as myeloid derived dendritic cells.  Circulating monocytes have been described as either being classical monocytes or nonclassical CD16+ proinflammatory monocytes, which comprise up to 10% of the monocytes in peripheral blood and have unique functions compared with classical monocytes.

Human immune system studies rely heavily on the phenotypic and functional assessments of PBMCs.  In order to take advantage of PBMCs for human immune studies, it is important to know what populations are represented in peripheral blood and how PBMC populations differ in distribution and function from tissue immune cells.  Finally it is critical to become familiar with the identifying surface and intracellular markers and the types of assays best suited for human PBMC studies.  The markers most suitable for identification of the major immune populations in human PBMC using flow cytometry will be the topic of the next blog.