Using Phospho-Flow Cytometry to Study Signaling in Human PBMCs

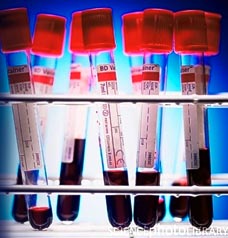
One thing that every immunologist agrees on is that immune cells are heterogeneous, and human peripheral blood mononuclear cells (PBMC) contain many different immune cell types.  CD4+ T cells alone exist in dozens of uniquely functioning subsets.  Receptor mediated signal transduction events in response to signals such as cytokines, chemokines, various receptor ligands, and engagement of the T cell or B cell receptors represent an important aspect of immune cell communication and the many types of immune cells present in human PBMC are differentiated by these responses.  Trying to derive mechanisms from averages of complex PBMC populations obscures the understanding of the relationships that occur between expression of proteins and signaling states in unique cell populations and on the single cell level.

Dr. Gary Nolan and colleagues pioneered a method using flow cytometry to look at cell signaling in single cells using antibodies targeting phosphorylated protein sites, termed phospho-flow cytometry or “phosflow”.  In phosflow, PBMCs or other cell populations are stimulated with signaling receptor ligands and/or antagonists for a period of time.  Then the cells are fixed using paraformaldehyde-based buffers to lock the cells in their induced states of phosphorylation.  The cells are then permeabilized and stained with fluorescently-labeled antibodies against the phosphorylated proteins, antigens to identify cell populations, and other proteins of interest, and analyzed on a flow cytometer.

Using this method, our lab has assessed the response to many cytokines by analyzing phosphorylation of the STAT family of transcription factors, as well as phosphorylation events that occur downstream from T cell receptor (TCR) and B cell receptor (BCR) engagement, and Toll-like receptor ligation, such as NF-kB (p65), ERK, p38, and ZAP70BD Biosciences is a key resource for many of the reagents needed to perform these assays, providing several different buffers and antibodies against many important signaling targets.

LPS Monocytes p38 Phosflow resized 600

There are several considerations for optimizing this protocol.  The first is selecting the proper permeabilization method.  Nolan and colleagues published a protocol in which 100% methanol is used for permeabilization following fixation, and this is the method I have used most frequently.  One key advantage with this method is that following methanol permeabilization, the cells can be stored for an extended period of time at -20ºC or -80ºC prior to staining with the antibodies and running the flow cytometry.  Thus, many samples can be stimulated on different days, but the flow cytometry analysis can be performed later in a large batch, in order to limit the variability between staining intensities that can otherwise occur between experiments.  This is very important because when analyzing phosflow data, the fluorescence intensities which translate to magnitude of the phosphorylation of the protein target is often the key factor being analyzed, although the percentage of cells able to respond to a given signal can also be an important parameter for analysis.  However, there are a number of commercially available buffer sets for these assays which should be selected based on the phospho-proteins and other antigens of interest.

Another important factor to consider when setting up these assays is selection of the target antigens for identifying cell populations of interestSome antigens do not survive permeabilization with some of these reagents, including methanol.  For instance, I have had poor luck trying to identify B cells using CD19 or monocytes using CD14. CD20 and CD33 have been used respectively as alternatives that work well with methanol.

Cytobank, an online resource dedicated to phosflow created by Gary Nolan’s lab, is great for assisting in selecting the proper antigens and antibody clones for phosflow.  This website lists antibodies, including the phospho-target antibodies, that have been successfully and unsuccessfully tested with BD Biosciences’ various permeabilization buffers.

In summary, phosflow is an excellent method for analyzing signal transduction events in complex cell populations.  Using single cell assays for studies on protein expression and signaling will drive our understanding of the immune system’s complexity to the next level.


Nolan lab Phosflow protocol:

Single-cell phospho-protein analysis by flow cytometry. Schulz KR, Danna EA, Krutzik PO, Nolan GP.Curr Protoc Immunol. 2012 Feb;Chapter 8:Unit 8.17.1-20.


BD Biosciences Phosflow Homepage:

http://www.bdbiosciences.com/research/phosflow/index.jsp?WT.ac=FP_Phosflow


Cytobank’s list of antibodies tested with various permeabilization buffers:

http://www.cytobank.org/facselect/


Further Reading:

Flow cytometric analysis of cell signaling proteins. Suni MA, Maino VC.  Methods Mol Biol. 2011;717:155-69.

Single-cell, phosphoepitope-specific analysis demonstrates cell type- and pathway-specific dysregulation of Jak/STAT and MAPK signaling associated with in vivo human immunodeficiency virus type 1 infection.  Lee AW, Sharp ER, O’Mahony A, Rosenberg MG, Israelski DM, Nolan GP, Nixon DF. J Virol. 2008 Apr;82(7):3702-12.


Identification of CD4+ TH1, TH2, and TH17 populations in human PBMC

T cells present in human peripheral blood mononuclear cells (PBMC) are complex populations of different subtypes with unique functions.  CD4+ and CD8+ T cells are most simply classified as naïve, central memory, effector memory, and terminally differentiated effector subtypes, and T cells are currently thought to differentiate along this progression path following antigen experience.  In a previous post, I discussed using CD3, CD4, CD8, CD45RA or CD45RO, and CCR7 or CD62L as markers for differentiating T cells into these subtypes by multiparametric flow cytometry.

In addition, CD4+ T cells can be even further characterized as to their specific functions.  The cytokine milieu present during T cell activation through the T cell receptor (TCR) guides T cells to differentiate into memory and effector T helper subtypes (TH) including TH1, TH2, and TH17 subsets, all of which are present in PBMC.

Each of these TH subtypes functions by expressing a unique set of cytokines and chemokine receptors in order to elicit specific responses in different tissue settings.  It is important to note that memory T cells maintain flexibility in their functionality and can be re-polarized into different subtypes if re-stimulated under an alternate TH inducing condition.

Using multiparametric flow cytometry, each of these TH subsets can be identified by expression of specific cytokines, transcription factors, and surface markers including chemokine receptors, although the various markers used in the literature to classify the same subset do not overlap entirely. Identification of TH subsets by surface markers simply requires surface staining and is the easiest assay to perform.  Transcription factor expression can be assessed, which requires intracellular/nuclear permeabilization protocols such as BD Biosciences’ FoxP3 Buffer Set.  Finally, intracellular cytokine production can be detected following TCR stimulation with anti-CD3 and anti-CD28 antibodies or the combination of Phorbol 12-Myristate 13-Acetate (PMA) and the Ca2+ ionophore, ionomycin.  This generally requires 4-6 hours of stimulation in the presence of protein transport inhibitors: either brefeldin A or monensin, which are optimal for different cytokines.

TH1 cells promote cellular immunity against viruses and intracellular bacteria.  TH1 cells have been characterized in many ways.  Production of IFNg following TCR stimulation is probably the most common and direct functional representation to assess TH1 in PBMC.   Alternatively, the expression of the chemokine receptors CXCR3 and CCR5 have been associated with TH1 but not TH2 or TH17 cells.  The transcription factor T-bet (TBX21) is the major factor regulating TH1 differentiation and is also a marker of TH1 cells that can be assessed by flow cytometry, although T-bet expression is promiscuous and can be expressed in TH17 cells.  Interestingly, expression of any of these markers may not overlap entirely with IFNg expression.  For instance, in central memory T cells, CXCR3+ cells are considered pre-TH1 cells and do not express IFNg, while in the effector memory population, a fraction of CCR5+ and CXCR3+ cells express IFNg.  As always, care must be taken when making comparisons between percentiles and functions of populations identified using different markers.

TH2 cells are the CD4 helper subtype that promotes immunity against extracellular pathogens and are involved in allergic inflammation.  TH2 cells in PBMC can be classified by production of TH2-specific cytokines including IL-4, IL-5, and IL-13 following TCR stimulation or PMA/ionomycin.  However, expression of these cytokines can be difficult to detect and expression of the surface receptors CRTH2, CCR4, or CCR3 are alternatives.  Again, expression of CRTH2, CCR4, or CCR3 does not mark all existing IL-4, IL-5, and IL-13 expressing TH2 cells and vice versa, although CRTH2 has been demonstrated to be quite effective.

TH17 cells are known as the subtype associated with inflammatory autoimmune diseases and protection from fungal infections.  TH17 cells are classified by expression of IL-17 or surface marker expression, being CCR6+CCR4+.   Expression of the TH17-specific transcription factor RORg/gt can also be assessed.  A fraction of IL-17 expressing cells can also express IFNg and TH17 associated markers CCR6 and RORg/gt. Some have even suggested that IL-17+IFNg+ cells are a transitional state when more plastic TH17 cells differentiate into effector TH1 cells.

As cytokine expression may be the most discrete method of describing a TH cell regarding its function, I have used cytokine expression as a measure of TH1 and TH17 cells in human PBMC.  However in the case of TH2 cells, expression of IL-4 and IL-13 was hard to detect by flow cytometry, even with PMA and ionomycin stimulation and thus I have instead utilized CRTH2.  The protocol that I have optimized for identification of TH1, TH2, and TH17 cells involves a 4 hour stimulation of PBMCs with anti-CD3 and anti-CD28 antibodies or with PMA + ionomycin in the presence brefeldin A.  Following this, I first stain for surface markers including CRTH2 to identify TH2 cells.  Then the cells are fixed and permeabilized using BD Biosciences’ Cytofix Cytoperm buffer set and stained for IFNg (TH1) and IL-17 (TH17).  Using this method I have never seen co-expression for any of these factors with the exception of a small population of cells that co-stain with IFNg and IL-17, as commonly described in the literature.

CD4 TH1 TH2 TH17  human PBMC resized 600

Taken together, selection of markers for assessing these populations must be done carefully, bearing in mind that cytokines characteristic of a TH subtype are not always co-expressed in all cells identified as that TH subtype by the surface markers and transcription factors discussed here.  Flow cytometry panels containing markers for all of these TH subtypes can allow measurement of more specific TH populations from PBMC by gating based on specific expression as well as exclusion of the other TH subtype markers.


Additional Reading

Heterogeneity of CD4+ memory T cells: functional modules for tailored immunity.  Sallusto F, Lanzavecchia A. Eur J Immunol. 2009 Aug;39(8):2076-82.

Chemokine receptor expression identifies Pre-T helper (Th)1, Pre-Th2, and nonpolarized cells among human CD4+ central memory T cells.  Rivino L, Messi M, Jarrossay D, Lanzavecchia A, Sallusto F, Geginat J. J Exp Med. 2004 Sep 20;200(6):725-35.

Human T cells that are able to produce IL-17 express the chemokine receptor CCR6.  Singh SP, Zhang HH, Foley JF, Hedrick MN, Farber JM. J Immunol. 2008 Jan 1;180(1):214-21.

Selective expression of a novel surface molecule by human Th2 cells in vivo.  Nagata K, Tanaka K, Ogawa K, Kemmotsu K, Imai T, Yoshie O, Abe H, Tada K, Nakamura M, Sugamura K, Takano S. J Immunol. 1999 Feb 1;162(3):1278-86.

How immune cells can promote cancer progression

Did you know that the immune system can actually help promote cancer?

The tumor microenviroment is a complex milieu containing stromal cells (such as immune cells and fibroblasts), signaling molecules such as cytokines, and extracellular matrix. There is growing evidence that immune cells in the tumor microenvironment can be tricked by tumor cells to help the cancer grow by promoting angiogenesis (new blood vessel formation), suppressing the anti-tumor immune response, and promoting growth by secretion of growth factors. Immune cells are also thought to aid in the metastatic process as well as confer resistance to various chemotherapies.  It is therefore extremely important to further understand the interplay between cancer cells and cells in the tumor microenvironment.

Immune cells present in the tumor microenviroment include effectors of adaptive immunity (immunity guided by specific identification of pathogens) such as T-cells, dendritic cells, and to a lesser extent, B-cells. Also present are cells of the innate immune system (non-specific identification of pathogens) such as macrophages and other myeloid derived cells, leukocytes, and rarely natural killer cells.

Cytotoxic T-cells, can kill tumor cells by secreting cytotoxic substances such as perforin, granzymes, and granulysin.  Their activity can be regulated by various cytokines or signals from helper T-cells or other cells in the tumor microenviroment.

The myeloid lineage in tumors, generally termed myeloid suppressor cells (MSC), are considered key in the aberrant growth promotion of tumor cells and suppression of the anti-tumor immune response.  They are considered the major inflammatory cells of many solid tumors, including breast and prostate. MSCs in tumors include, tumor associated macrophages (TAM), polymorphonuclear and monocytic myeloid derived suppressor cells (PMN and MO-MDSC)Similar to T-cells, MSC activity can also be modulated by signaling factors from the microenvironment and can be induced to become more anti-tumor and pro-inflammatory.

MSCs share similar functions and their role in cancer promotion is said to be several fold.  First, they can suppress the adaptive immune response and thus function as regulators of anti-tumor T-cell activity. Second, they can induce angiogenesis through secretion of vascular endothelial growth factors (VEGFs) and matrix remodeling enzymes.  Additionally, they can also promote growth and proliferation by secreting growth factors such as epidermal growth factor (EGF), fibroblast growth factors (FGFs) among others.

In non-pathological conditions, myeloid derived cells play a large role in wound repair also by promoting angiogenesis, growth and proliferation. Therefore, it is easy to deduce that during chemotherapy or any type of anti-tumor treatment a dying tumor cell may appear as a wound that needs repair or healing.

Further research to better understand the interplay of tumor cells and the microenvironment as well as how to better fine-tune the tumor microenvironment against cancer is imperative for the development of better therapeutic agents.

The BBB’s Role in Multiple Sclerosis & Alzheimer’s Disease

The blood-brain barrier (BBB) is a highly complex structure of the cerebral vasculature; it functions as a selective filter for certain molecules entering and exiting the brain. Through regulating the exchange of very specific molecules and cells between the central nervous system’s Cerebral Spinal Fluid (CSF) and the peripheral blood of the circulatory system, the BBB protects the brain and maintains the scrupulous environment required for neurons and other glial cells to function properly. The significant consequence of BBB disruption is the increased permeability, leading to extravasation of circulating peripheral blood mononuclear cells (PBMC), along with other unspecific molecules. Thus, BBB dysfunction plays a major role in a wide range of neurologic conditions, including Multiple Sclerosis (MS) and Alzheimer’s disease (AD).

MS is associated with the infiltration of CD4+ and CD8+ T-cells and B-cells within the acute inflammatory lesions or the areas of demyelination. The presence of these immune cells at these locations, indicate alterations in BBB structure, which allowed their crossing into the central nervous system (CNS).

During MS, perivascular lesions are formed by T-cells entering the CNS and releasing cytokines that cause inflammation of the endothelial lining (cells forming the blood vessels). This inflammatory response stimulates vasculature in MS lesions to express several cell adhesion molecules (CAMs). The interaction between these CAMs and their leukocytic integrins, permit immune cells to adhere to the inflamed cerebral vasculature, cross the BBB, and proceed to infiltrate the parenchyma. This inflammatory reaction is a vicious cycle; as more immune cells are activated within the CNS, the inflammation amplifies, leading to further BBB damage and recruitment of additional lymphocytes, such as B-cells and cytotoxic T-cells, responsible for the eventual activation of associated macrophages to destroy Myelin. In addition, it has been reported that the firm attachment of monocytes to endothelial cells, stimulates monocytes to secrete reactive oxygen species (ROS) that may further increase BBB permeability to T-cells  and macrophages.

The initial stimulant of MS is not yet clear. Nonetheless, many recent studies suggest that BBB disruption is an early event in MS lesion formation, followed by the massive infiltration of immune cells, which proceed to destroy the myelin and damage the oligodendrocytes.  

T-cells,Multiple Sclerosis,MS,Immune response

Several cerebrovascular abnormalities, such as damaged endothelial and pericyte, microvascular degeneration, reduced glucose transport across the BBB, and abnormal expression of inflammatory markers in the cerebral vasculature have been described in Alzheimer’s disease patients. These observations are associated to the deposition of the β-amyloid peptide (Aβ) in the walls of the BBB vasculature which lead to the loss of certain tight junction proteins that result in disruption of the BBB and eventual cerebral neuroinflammation through activating microglia

The two pathological hallmarks of AD are: 1) the increased production and accumulation of amyloid-β peptides (Aβ)- derived from amyloid precursor protein (APP)- forming neuritic/senile plaques in the brain tissue, 2) the intraneuronal neurofibrillary tangles (NFTs) composed of hyperphosphorylated tau protein, which lead to the loss of synapses and neurons in affected regions. Consequently, these factors in addition to a reduction of Aβ clearance from the brain, which leads to its extracellular accumulation, and its direct toxic effects, induce the subsequent activation of microglial cellsthis inflammatory response results in the release of numerous inflammatory neurotoxic cytokines that will disrupt the neurons’ cytoskeleton, leading to their dysfunction and eventual cellular death.

Alzheimer's disease associated senile plaques

Recent studies suggest that transforming growth factor-β1 (TGF-β1) may play a role in BBB dysfunction in AD pathogenesis. TGF-β1 has a constitutive role in the suppression of inflammation and control microglial activation in the CNS. These observations indicate a significant impairment of TGF-β1 signaling in AD brain. Furthermore, astrocytes may be reactivated by TGF-β1, which would result in further production of Aβ and undergo the aggravating astrogliosis. 

Although it is not yet clear whether these vascular changes are an initial cause for development of AD or if they take place during the later stages of the disease, most Alzheimer’s  patients exhibit vascular pathology and develop  intracerebral hemorrhage and cerebral infracts 


In conclusion, there is strong evidence pointing to the involvement of the BBB dysfunction in many neurologic disorders including MS and AD. Moreover, one common denominator of the BBB malfunction in these diseases is the close association of the astrocytes activated by the interactions between the immune cells and the cerebral vasculature, leading to further increased permeability of BBB. However, further investigations must focus on identifying the mechanisms responsible for the initial cause of the the inflammatory cascade, and the destructive interactions between reactivated astorcytes and endothelial cells lining the BBB. 


Further Reading:

Current and future treatments for Alzheimer’s disease. Yiannopoulou KG, PapageorgiouSG. (2013) Ther Adv Neurol Disord, 6(1) 19–33.

Inflammatory events at blood–brain barrier in neuroinflammatory and neurodegenerative disorders: Implications for clinical disease. de Vries HE, Kooij G, Frenkel D, Georgopoulos S, Monsonego A, Janigro D. (2012) Epilepsia, 53(Suppl. 6):45–52.

New concepts in the immunopathogenesis of multiple sclerosis. Hemmer B, Archelos JJ, Hartung HP(April 2002) Nature Reviews Neuroscience, 3291-301.  

Neuroinflammation and blood–brain barrier changes in capillary amyloid angiopathy.Carrano A, Hoozemans JJ, van der Vies SM, van Horssen J, de Vries HE, Rozemuller AJ. (2012) Neurodegener Dis, 10:329– 331.

Tricks for analyzing PBMC populations by flow cytometry

Flow cytometry allows assessment of protein expression on a single cell level.  Because of the diversity of populations comprising peripheral blood mononuclear cells (PBMC), flow cytometry represents the best method for studying the functional and phenotypic properties of these cell subsets.  There have been a number of publications that present multiparametric flow cytometry staining panels for assessing PBMC populations, and as an easy first step into these assays, these panels can be referenced (see a few examples below).

However, use of these established panels may not suit further exploratory questions, and thus an understanding of the best methods for designing flow cytometry panels is needed.  Because of the many identified populations and the upper limits of markers that can be simultaneously used in flow cytometry, a lot of thought must go into planning these assays.

Flow cytometry utilizes fluorophore-conjugated antibodies targeting antigens of interest.  Antigenic markers uniquely present on PBMC population subsets have been actively sought after by the immunology community. The upper limit of the number of markers that can be simultaneously assessed depends on several parameters.  Most obviously, this depends on the specs of the flow cytometer instrument available.  I presently use a modified version of the BD LSR Fortessa, with five lasers, and allowing detection of up to 17 parameters plus forward and side scatter.

Unfortunately, because of overlap in the excitation and emission spectrums of available fluorophores, this doesn’t mean that I am able to successfully co-analyze 17 PBMC markers.  The fluorescence emitted from a given fluorophore may be detected or “spill over” into the range of detectors optimized for other fluorophores.  Although flow cytometry software is capable of calculating the percent spillover from this spectral overlap and subtracting this estimated fluorescence from the affected channels by a process known as compensation, this is not a perfect science. Due to spectral overlap, there are a few points to consider when designing an antibody “staining panel” for your immunological assessments.

First, select the fluorophores you hope to use in your panel.  To do this, determine the laser and detector configurations of your cytometer.  This will tell you for which fluorophores the excitation and emission spectrums are optimal on your instrument.

Next, choose detection channels to try first based on minimal excitation and emissions overlap.  Alternatively, consult previously published panels to see which fluorophore combinations have been recommended.  As an example, for my instrument’s 561nm laser, there are 5 detectors, so if I had to choose 3 of these, it would simply be every-other one based on the detector’s spectral range.  However, fluorophores can overlap in not only their emission but also their excitation spectrums.  Thus, it is important to look across the detectors for different lasers.  For instance on my instrument, there is a 780/60BP detector on the 561nm laser for detection of PE-Cy7, and the same detector on the 640nm laser for detection of APC-Cy7.   Thus the use of these channels together may be complicated if the fluorophores have a wide excitation range.  BD Biosciences has an awesome fluorescence spectrum viewer for envisioning the spill-over between parameters based on your cytometer configurations.  Other companies such as Life Technologies, eBioscience, and Biolegend also have similar tools to reference for fluorophores not sold by BD Biosciences.

It is important to mention that fluorophores are improving all the time.  Newer chemistries have led to development of product lines such as the Brilliant Violet dye series and Q-Dots with highly improved excitation and emissions spectrums for minimal spill-over.  Thus, for each channel, there could be several fluorophores that fit the optimal excitation and emission properties but select the one with optimal qualities of not only brightness but also their excitation and emission spectrums.

Once you have selected a likely handful of combinable fluorophores, it is time to figure out which cellular markers to target with which fluorophores.  To do this, first determine which markers of interest in your staining panel are co-expressed.  If there is no co-expression of your selected markers, it becomes easier to utilize antibodies tagged with spectrally overlapping fluorophores.  For instance, Pacific Blue and V500 have an approximately 10-20% spillover into the other’s channel on my LSR Fortessa’s configurations.  However, when not co-expressed, for instance CD4 and CD8, the fluorescent spill-over and hence compensation issues between these fluorophores are minimized, i.e. if there is no expression of Pacific Blue, then there is nothing to subtract from the V500 channel and vice versa.  However, if markers are co-expressed, such as CD4 and CD45RA, then issues with compensation between these parameters may lead to over or under-subtraction of fluorescence values in CD4+CD45RA+ populations compared with single positive populations.  But if your objective is only to gate these populations for analysis of other markers or to determine population percentages, then markers such as these may be successfully utilized together if these populations are visually discernible on cytometry data plots.  Another key thing to mention is for the lower expressing antigens, choose the brightest fluorophores.

But we’re not finished yet.  Next, determine for which markers your objective is to gain information about fluorescence intensity.  Now take the example from above but imagine that your question involved the magnitude of CD45RA expression on the CD4 versus CD8 population of PBMC T cells.  I have not done this example directly, but I can imagine that having high levels of compensation between one but not another parameter (in this case between CD4 and CD45RA but not between CD8 and CD45RA), may lead to inaccuracies in the relative fluorescence intensities.   Thus, in this example, if CD45RA is the marker for which expression intensity is the question, then the overlapping spectral fluorophores Pacific Blue and V500 would be best suited for identifying CD4 and CD8, while a fluorophore with minimal compensation issues with these channels, such as PE, would be best for CD45RA.  Thus, for markers in which determining fluorescence intensity is your objective, choose fluorophores with the least spectral overlap with all of the others in your panel.

PBMCAnalysisByFlowCytometryCD3CD4CD20 resized 600

Finally here’s another trick:  you can use two exclusively expressed markers in the same channel, as long as there is a third marker to differentiate these populations.  For example, I have very successfully used CD4-PerCP-Cy5.5 (CD4+ T cells) together with CD20-PerCP-Cy5.5 (B cells) along with CD3-V450 to differentiate the T cells from B cells in human PBMC.  In this case, CD4+ T cells will be double positive in V450 and PerCP-Cy5.5 channels, while CD20+ B cells will be PerCP-Cy5.5+ but V450, and CD8+ T cells will be PerCP-Cy5.5 and V450+.

In summary, multiparametric flow cytometry analysis of PBMCs can be tricky, but with these and other tricks up your sleeve it becomes much easier to successfully design panels optimal for the questions you are asking and to maximize the number of parameters in your flow cytometry staining panels.


Examples of established multiparametric flow cytometry panels:

Standardizing immunophenotyping for the Human Immunology Project.  Maecker HT, McCoy JP, Nussenblatt R.  Nat Rev Immunol. 2012 Feb 17;12(3):191-200.

Multiparameter flow cytometry monitoring of T cell responses.  Maecker HT.  Methods Mol Biol. 2009;485:375-91.

11-color, 13-parameter flow cytometry: identification of human naive T cells by phenotype, function, and T-cell receptor diversity.  De Rosa SC, Herzenberg LA, Herzenberg LA, Roederer M. Nat Med. 2001 Feb;7(2):245-8.

Nine-color flow cytometry for accurate measurement of T cell subsets and cytokine responses. Part I: Panel design by an empiric approach. McLaughlin BE, Baumgarth N, Bigos M, Roederer M, De Rosa SC, Altman JD, Nixon DF, Ottinger J, Oxford C, Evans TG, Asmuth DM. Cytometry A. 2008 May;73(5):400-10.


BD Bioscience’s Fluorescence Spectrum Viewer:

http://www.bdbiosciences.com/research/multicolor/spectrum_viewer/index.jsp

DNA sequencing from peripheral blood test detects cancer

Aberrant alteration of chromosomal DNA drives the development and progression of cancer. There are a variety of alterations that promote tumorigenesis including aneuploidy, chromosomal translocation, gene amplification, and point mutations.

The ability to identify these abnormalities in cancer patients is central to disease diagnosis, staging, and treatment. The current methods that are used clinically to identify chromosomal changes rely on molecular analyses of tissue from tumor biopsies. While biopsy samples provide a wealth of information about the molecular abnormalities in tumors, they often require invasive procedures which may be prone to sampling error. The ability to detect chromosomal changes that cause cancer in peripheral blood samples may allow earlier and more accurate diagnosis.

In a recent study in Science Translational Medicine, researchers at Johns Hopkins University show that it is possible to get detailed information about the molecular characteristics of a tumor’s chromosomal DNA from peripheral blood samples. The authors exploit the fact that dead or dying tumor cells frequently dump their contents into the bloodstream. A major component of these intracellular contents is the chromosomal DNA that contains the deleterious alterations that drive tumor growth. The authors isolated this circulating cell-free DNA (CFDNA) from both cancer patients (colon and breast cancer, specifically) and healthy volunteers and used whole genome sequencing (WGS) to assess for chromosomal abnormalities. The authors saw chromosomal abnormalities such as, chromosomal copy number changes and genomic rearrangements, in the CFDNA specifically from cancer patients and not from healthy volunteers. Interestingly, the chromosomal abnormalities that the authors detected corresponded to common mutations seen in these types of cancers. Previous studies have shown that it is possible to observe oncogenic changes in chromosomal DNA from the peripheral blood of cancer patients. However, these methods required prior knowledge of what chromosomal changes might be present—that is, the investigators could only find the specific mutations that they were looking for. The current study demonstrates that it is possible to measure chromosomal changes in tumors using blood samples without advanced knowledge of the mutations that caused the cancer. This opens up the possibility of being able to fully characterize the unique molecular defects in a patient’s tumor and allowing for individual tailoring of therapy. The authors also compare chromosome arm alterations from colorectal cancer cell lines and xenografts to the blood from the colon cancer patients.  They found that both showed ≥5 chromosomal alterations compared to healthy volunteers (less than 2.4 alterations).

Although this technology is promising, substantial obstacles must be overcome before WGS on peripheral blood becomes a widely-used clinical technique. First, the sensitivity of WGS depends on the amount of mutant CFDNA obtained for sequencing. Chromosomal abnormalities that are present in small amounts may be missed (i.e. small tumors). Of note, the patients analyzed in this study all had advanced disease. Further investigations into whether this technique can identify chromosomal abnormalities during early stage disease or in instances of diagnostic uncertainty are warranted. Second, it is not clear to what extent the chromosomal abnormalities detected in peripheral blood represent the molecular defects in actual tumors. Are there additional mutations contained in tumor tissues that do not show up in the blood? Further study is necessary comparing peripheral blood sequencing analyses to those performed on biopsy samples obtained from the same patient. This will be especially important for applications which seek to use the information garnered from WGS of peripheral blood to guide treatment decisions. Finally, the sequencing techniques used in this study are expensive and preclude routine clinical use at this time. Although, based on the current trend of rapidly deceasing costs associated with next-generation DNA sequencing technologies it is plausible that clinical testing of this sort will become affordable in the near future.

Basic markers of T cell populations in human PBMC

Human peripheral blood mononuclear cells (PBMC) are comprised of complex populations of T cells, B cells, NK cells, monocytes, and dendritic cells.  In addition, there are more complicated cell types such as NKT cells that are thought of as T cells that share many properties of NK cells.  Within all of these basic populations are many functionally unique subsets.  Because of the diversity of populations in PBMC, flow cytometry represents the best method for studying functional and phenotypic properties of these cell subsets.  In the next few blog posts, I will discuss selection of markers for studying PBMC populations using flow cytometry and the best way to arrange these markers in flow cytometry staining panels.

The PBMC cell type I have the most experience with characterizing is T cells.  CD3, a T cell specific marker, is necessary to differentiate T cells from other populations, simply because CD4 and CD8 can be expressed by other cell types.  CD8 can be expressed on NK cells, while CD4 can be expressed on populations of monocytes and dendritic cells.  CD4 and CD8 are also necessary markers for identification of these two major T cell populations.

CD4 and CD8 T cells are most simply classified as naïve or antigen experienced populations including central memory, effector memory and effectors.  Central memory and effector memory populations are known to differ in their effector functions and ability to home to different anatomical sites.  Two markers are necessary to differentiate naive, central memory, effector memory and effector T cell populations present in PBMC.

The first is CD45, a protein tyrosine phosphatase regulating src-family kinases, is expressed on all hematopoietic cells.  CD45 can be expressed as one of several isoforms by alternative splicing of exons that comprise the extracellular domain. CD45RA is expressed on naïve T cells, as well as the effector cells in both CD4 and CD8.  After antigen experience, central and effector memory T cells gain expression of CD45RO and lose expression of CD45RA.  Thus either CD45RA or CD45RO is used to generally differentiate the naïve from memory populations.

However, differentiation between central and effector memory populations and between naïve and effector populations can be achieved by adding a second marker.   There are several markers that have been used for this purpose and these tend to mark these populations at slightly different stages of the differentiation pathway that is thought to occur in T cells as they change from central to effector memory cells.  The chemokine receptor CCR7 is considered the gold standard for this discrimination, and the lymph node homing receptor CD62L is a close second choice.  Naïve and central memory cells express these receptors in order to migrate to secondary lymphoid organs, while the absence of these receptors allows for effector memory and effector cells to accumulate in peripheral tissues.  CCR7 has been classically thought to be difficult to stain for due to low expression levels, and as a result I have never used it.  However, a recent review article pointed out that a new brighter staining antibody to CCR7 has been developed (clone 150503), and is something I hope to test in the near future.  CD62L has generally been my marker of choice, however CD62L expression is lost following density gradient centrifugation, cryopreservation, TCR ligation or activation with PMA/ionomycin.  Thus CD62L as a marker is best utilized following overnight culturing subsequent to thawing cryopreserved cells.  Other potential markers are CD27 and CD28 which are also more highly expressed by the central memory and naive populations.  However, it is important to note that each of these markers, CCR7, CD62L, CD27, and CD28, marks slightly different populations of cells and care must be taken when making comparisons between populations defined by different markers for assessing frequencies or functions.

In summary, naïve T cells are CD45RA+CD45ROCCR7+CD62L+, central memory T cells are CD45RACD45RO+CCR7+CD62L+, effector memory T cells are CD45RACD45RO+CCR7CD62L, and effector cells are CD45RA+CD45ROCCR7CD62L.  Thus, CD3, CD4, CD8, CD45RA or CD45RO, and CCR7 or CD62L or CD27, are a great starting point for designing flow cytometry panels for the assessment of T cells present in human PBMC.  T cells populations, however, are much more complex, and may be further classified by helper subtypes and activation status, which will be discussed in a later blog.

describe the image

The use of CD45RA and CD62L to differentiate naive, central memory, effector memory and effector T cell populations present in PBMC.  Naïve CD4 and CD8 T cells are CD45RA+CD45ROCCR7+CD62L+ (B, F), central memory T cells are CD45RA- CD45RACD45RO+CCR7+CD62L+ (A, E), effector memory T cells are CD45RACD45RO+CCR7CD62L (C, G), and effector cells are CD45RA+CD45ROCCR7CD62L (D, H).


Further Reading:

Central memory and effector memory T cell subsets: function, generation, and maintenance.   Sallusto F, Geginat J, Lanzavecchia A. Annu Rev Immunol. 2004;22:745-63.

The Promise of Induced Pluripotent Stem Cells

Human embryonic stem cells (hESCs) hold great potential for cell replacement therapies, where cells are lost due to disease and/or injury. During the last decade, we have witnessed the development of the induced pluripotent stem cell (iPSC) technology, which revolutionized the stem cell field, as well as the regenerative medicine. Since the source of the reprogrammed cells (e.g., fibroblasts, keratinocytes, etc.) as part of the generation of iPSCs is readily accessible, this opened up an entirely new chapter in regenerative medicine by significantly reducing immune rejection problems after transplantation. Furthermore, by taking somatic cells directly from patients, we now have the ability to create disease models (also know as “disease in a dish”) for many conditions that were not possible before. As of today, numerous diseases have been modeled using iPSCs and many researchers are exploring the possibility of utilizing iPSC-derived cells for cell replacement therapy.

One of the pioneers of the iPSC work, Shinya Yamanaka, was awarded the Nobel Prize in Physiology or Medicine (together with John B. Gurdon) this year. Considering that Dr. Yamanaka’s first study related to iPSCs was published in 2006, it’s easy to appreciate the enormous impact that this technology has created as substantiated by the decision of the Nobel Prize committee. If we look back at the chronological events, the initial report from the Yamanaka group using mouse fibroblast and 4 transcription factors (i.e., Oct4, Sox2, Klf4 and c-Myc) to create iPSCs was published in 2006 (Takahashi and Yamanaka, 2006), followed by the demonstration in 2007 (Takahashi et al., 2007) that a similar approach was applicable for human fibroblasts, and by introducing a defined set of transcription factors, human iPSCs can be generated. On the same day Yamanaka published his human iPSC paper, Jamie Thomson’s group also demonstrated the generation of iPSCs from human cells using a different set of factors (Yu et al., 2007).

describe the image
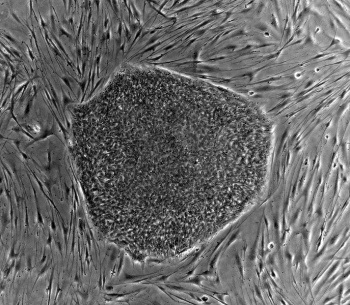
Even though, iPSCs can be generated reproducibly, the efficiency of the reprograming remains low (i.e., around 1% using the original method). Furthermore, the initial generation of iPSCs utilized either retroviruses or lentiviruses, which both integrate into the host genome and might cause insertional mutagenesis, collectively creating a risk for translational applications. However, the beauty of the iPSC technology is its simplicity and reproducibility. Since 2007, iPSCs have been in the central focus of stem cell research and regenerative medicine, and researchers throughout the world have made a number of improvements to Yamanaka’s original protocol. Today, we have safer and more efficient methods for generation human iPSCs for disease modeling or cell replacement therapies, and by the look of how much has been achieved so far, the technology is only going to get better and more proficient. Considering that human embryonic stem cell derived approaches have been successfully used at the clinical level for cell replacement therapies, there is no doubt that iPSCs will eventually prove to be the ultimate source for regenerative medicine in the future.

Types of immune cells present in human PBMC

When peripheral whole blood is drawn for human immune system studies, it is often processed to remove red blood cells by density gradient centrifugation. Most commonly this method uses Ficoll Paque, a solution of high molecular weight sucrose polymers, a product of GE Healthcare Ltd.  Ficoll separates whole blood into two fractions above and below the density of 1.077g/ml.

Peripheral blood mononuclear cells (PBMC) are the populations of immune cells that remain at the less dense, upper interface of the Ficoll layer, often referred to as the buffy coat and are the cells collected when the  Ficoll fractionation method is used.

Erythrocytes (red blood cells) and polymorphonuclear cells (PMNs) which include neutrophils and eosinophils are generally removed during this fractionation as they are denser then 1.077g/ml.  Basophils, however can be greater or less dense then 1.077g/ml and thus may be present to a small degree in the less dense PBMC fraction.

PBMCs include lymphocytes (T cellsB cells, and NK cells), monocytes, and dendritic cells.  In humans, the frequencies of these populations vary across individuals.  In my experience as well as that of others, lymphocytes are typically in the range of 70 – 90% of PBMCs, monocytes range from 10 – 30% of PBMCs, while dendritic cells are rare, being only 1 – 2% of PBMCs.  The frequencies of cell types within the lymphocyte population include 70 – 85% CD3+ T cells (45 – 70% of PBMC), 5 – 20% B cells (up to 15% of PBMC), and 5 – 20% NK cells (up to 15% of PBMC).

The CD3+ compartment is composed of CD4 (25 – 60% of PBMC) and CD8 T cells (5 – 30% of PBMC), in a roughly 2:1 ratio.  Both CD4 and CD8 T cells can be further subsetted into naïve, and the antigen-experienced central memory, effector memory, and effector subtypes that exist in resting or activated states.  Multiple markers can be used to identify these compartments to varying similarities and thus the frequencies reported by people using different markers may vary.

CD4 T cells are known as helper T cells and can be further classified into various functional subtypes based on the expression profiles of specific cytokines, surface markers, or transcription factors.  These include regulatory T cells, TH1, TH2, and TH17 cells as well as other described subpopulations such as TH9, follicular helper, and TR1 types.  These classifications however will certainly become more complex in the future, as recently the cytotoxic CD8 T cell compartment has been to shown to be extremely heterogenous in marker expression and function and may be comprised of roughly 200 functional phenotypes.

Dendritic cells 2

Circulating B cells include transitional, naïve, and memory subtypes as well as plasmablasts, all of which can be found at varying populations in peripheral blood.  Circulating dendritic cells include plasmacytoid dendritic cells as well as myeloid derived dendritic cells.  Circulating monocytes have been described as either being classical monocytes or nonclassical CD16+ proinflammatory monocytes, which comprise up to 10% of the monocytes in peripheral blood and have unique functions compared with classical monocytes.

Human immune system studies rely heavily on the phenotypic and functional assessments of PBMCs.  In order to take advantage of PBMCs for human immune studies, it is important to know what populations are represented in peripheral blood and how PBMC populations differ in distribution and function from tissue immune cells.  Finally it is critical to become familiar with the identifying surface and intracellular markers and the types of assays best suited for human PBMC studies.  The markers most suitable for identification of the major immune populations in human PBMC using flow cytometry will be the topic of the next blog.

Research digest: Interesting new findings in cancer research


  • cancer research
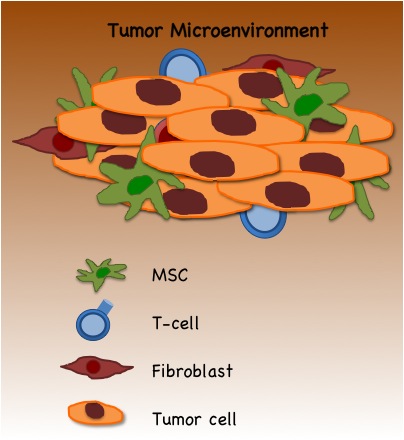
The immune system is the body’s primary defender against cancer. In a recent article in Science magazine, Dr. Senovilla and colleagues report a novel mechanism that cells of the immune system use to identify carcinogenic cells.  They show that a protein called calreticulin, which normally resides in the endoplasmic reticulum, is present on the surface of polyploid (extra chromosomes) cells. This serves as a beacon for immune cells to destroy these cells and ultimately lead to the selection against them.
  • Mammography (low dose x-ray imaging) is the most common breast cancer imaging technology, for early screening although many limitations exist.  For example, it is estimated that the about 20% of cancers go undetected by mammograms leading to false negative diagnosis.  Another issue with mammography is that the technology uses radiation and over time and repeated exposure could actually increase the risk of cancer.  Computed tomography (CT) can reduce some of the radiation exposure but at the cost of lowering resolution of the images making it harder to detect some cancers.  Dr. Zhao and colleagues from the California NanoSystems Institute at UCLA devised a new method for 3D imaging using phase contrast x-ray in combination with a novel image reconstruction program.  Researchers report a 74% reduction in radiation dosing, image acquisition time, increased resolution and contrast.
  • A well-documented phenomenon is the result of chronic inflammation to induce carcinogenesis.  Inflammatory cells secrete cytotoxic molecules that are intended to kill cancerous cells but during chronic inflammation, repeated exposure to cytotoxic molecules can lead to DNA damage.  This damage can result in oncogene activation or tumor suppressor gene inhibition.  Researchers at the University of North Carolina at Chapel Hill, Chapel Hill show that colitis (inflammation of the large intestine, colon) can also lead to imbalances in the natural microflora.  Imbalances of certain microorganism with genotoxic (DNA damage) ability can lead to DNA damage in the intestine and initiate carcinogenesis.


  • Resistance to cancer development varies greatly from species to species.  Anti-cancer adaptations lend cells the ability to deal with genomic alterations potentially leading to carcinogenesis.  Subterranean rodents, blind mole rats, Spalax (BMR) display resistance to cancer development.   Researchers at the Department of Genetics and Complex Diseases at Harvard School of Public Health found that cells from BMR animals after multiple replication cycles perform concerted cell death in response to hyperproliferation as an anti-cancer mechanism.
  • Chemotherapeutic, Doxorubicin is a common treatment option for a wide range of cancers.  One of the most serious side effects is cardiomyopathy (damage to heart muscle) by a mechanism that up to now remained unclear.  Doxorubicin inhibits cellular replication by binding DNA and inhibiting the function of the DNA detangling enzymes, topoisomerase-II-α and –β (Top2-α and –β) and Top2-α is considered a marker of cell proliferation and thus this drugs target for cancer treatment.  Dr. Zhang and colleagues show that Top2-β, the other target of this drug is expressed on heart tissue and is inhibited by Doxurubucin providing an explanation for its cardiotoxicity.