Weird but common T cell populations in human PBMC

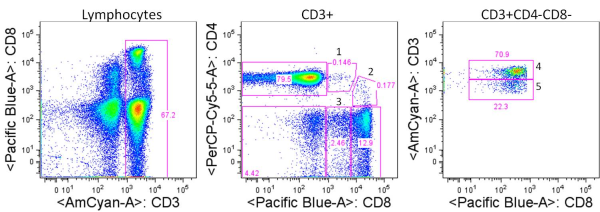
Human T cells are generally analyzed for expression of CD4 and CD8 to classify them as either of these two major classes of effector T cells.  But flow cytometry analysis of PBMCs stained with antibodies targeting CD3, CD4, and CD8 reveals several other populations with varying expression of these three markers.  So what are they?

For the sake of this discussion, I will refer to the largest typical single positive populations of CD3+CD4+ and CD3+CD8+ T cells as CD4high and CD8 high, respectively.

These are some other T cell populations that have been observed in human PBMC:

CD8lowCD4high (1): Populations of CD4 T cells that express CD8.  This population is likely heterogeneous, and compared with the CD4high population, includes a higher proportion of effector memory and terminally differentiated effector CD4 T cells that have re-expressed CD8.  CD8 is expressed as a heterodimer of either α/α, α/β, or β/β, and this population has been noted to be primarily CD8α/α.  Work by Zloza et. al, identified that up to 50% of these cells can be NKT cells, including invariant CD3+6B11+ NKT cells and non-invariant CD3+CD16/56+ NKT cells.  Of note, NKT cells may also be present at low frequencies in CD4+CD8+, CD4CD8, CD4 or CD8 single positive populations.

CD4lowCD8high (2): Populations of CD8+ T cells, of the primarily CD8α/β type that express CD4.   This population can be further subdivided into two groups:  CD4dimCD8high and CD4medCD8high.  Studies have shown that expression of CD4 on these CD8+ T cells is functional and inducible by stimulations such as anti-CD3/CD28.   These cells express markers of activated T cells and exhibit a higher frequency of memory cells (CD45RA) as compared with typical CD8high cells.

CD8low (3): These cells express CD8 at lower levels compared with CD8 high populations, are negative for CD4 expression, and can express higher levels of CD3.  Trautmann et. al, describe the frequency of CD8 low cells as being from 0.2%-7% of CD8 T cells in healthy donors and described these cells as populations of oligoclonal cytotoxic terminally differentiated effector CD8 T cells (CD45RA+CD62L).

WeirdCD3CD4CD8 Tcell Populations resized 600

CD4neg CD8neg CD3high (4):  CD4 and CD8 double negative cells that express high levels of CD3 compared with CD4 high and CD8 high populations.  This fraction has been shown to contain largely the TCRγ/δ T cell subset although γ/δ T cells can express and the CD8α and/or the CD8β chains.

CD4neg CD8neg CD3pos (5): This fraction has been shown to largely contain heterogeneously differentiated TCRα/β T cell subsets including regulatory T cells.  The expression of CD3 on this subset is lower than that of the CD4neg CD8neg CD3high subset containing γ/δ T cells, although γ/δ T cells may be present in this population as well.

An important thing to note is that characterizations of these populations are generalizations and individuals have been shown to have aberrant profiles compared with these.  Other populations have been described such as CD4high CD8high double positive cells which may be primarily effector memory T cells but here I have focused on those populations I see most frequently.   In summary, careful gating and analyses of each of these populations is necessary, as these are not only functionally unique subsets, but each population appears to be heterogeneous and also contain varying percentages of NKT cells.


Further Reading:

CD4(+)CD8(dim) T lymphocytes exhibit enhanced cytokine expression, proliferation and cytotoxic activity in response to HCMV and HIV-1 antigens.  Suni MA, Ghanekar SA, Houck DW, Maecker HT, Wormsley SB, Picker LJ, Moss RB, Maino VC. Eur J Immunol. 2001 Aug;31(8):2512-20.

Multiple populations of T lymphocytes are distinguished by the level of CD4 and CD8 coexpression and require individual consideration.  Zloza A. and Al-Harthi, L. Journal of Leukocyte BiologyJ Leukoc Biol. 2006 Jan;79(1):4-6.

Characterization of circulating CD4+ CD8+ lymphocytes in healthy individuals prompted by identification of a blood donor with a markedly elevated level of CD4+ CD8+ lymphocytes.  Prince HE, Golding J, York J. Clin Diagn Lab Immunol. 1994 Sep;1(5):597-605.

Upregulation of CD4 on CD8+ T cells: CD4dimCD8bright T cells constitute an activated phenotype of CD8+ T cells. Sullivan YB, Landay AL, Zack JA, Kitchen SG, Al-Harthi L. Immunology. 2001;103: 270-280.

Human CD8 T cells of the peripheral blood contain a low CD8 expressing cytotoxic/effector subpopulation.  Trautmann A, Rückert B, Schmid-Grendelmeier P, Niederer E, Bröcker EB, Blaser K, Akdis CA. Immunology. 2003 Mar;108(3):305-12.

CD3 bright lymphocyte population reveal gammadelta T cells.  Lambert C, Genin C. Cytometry B Clin Cytom. 2004 Sep;61(1):45-53.

Isolation and characterization of human antigen-specific TCR alpha beta+ CD4(-)CD8- double-negative regulatory T cells.  Fischer K, Voelkl S, Heymann J, Przybylski GK, Mondal K, Laumer M, Kunz-Schughart L, Schmidt CA, Andreesen R, Mackensen A. Blood. 2005 Apr 1;105(7):2828-35.

Distinct CD4+ CD8+ double-positive T cells in the blood and liver of patients during chronic hepatitis B and C. Nascimbeni M, Pol S, Saunier B. PLoS One. 2011;6(5):e20145.

CD4+ CD8+ double positive (DP) T cells in health and disease.  Parel Y, Chizzolini C. Autoimmun Rev. 2004 Mar;3(3):215-20.

Antagonism of Tumor-Immunity by Chemotherapeutics

dendritic cellSignificant steps forward are being made in immunotherapeutic approaches for treatment of cancer.  Over the past few years, two cancer immunotherapeutics were FDA approved.  In 2010, Dendreon Corporation’s Provenge, an autologous cellular vaccine, was approved for hormone refractory metastatic prostate cancer.  In 2011, Bristol-Myers Squibb’s anti-CTLA4 antibody Ipilimumab, was FDA approved for late stage melanoma.  Recent promising clinical trial results indicate several additional immune modulating therapies are likely to join this prestigious list in the coming years.  In addition, combinations of immune therapies with chemotherapeutics are being tested in clinical trials.  In light of this, it is important to know how chemotherapies interact with the immune system, in order to best generate synergistic effects.

There are multiple ways that chemotherapies may modulate anti-tumor immunity.  Some therapeutics such as anthracyclines induce an immunogenic cell death characterized by release of endogenous danger signals such as HMGB1, that activate antigen presenting cells (APCs) to elicit anti-tumor T cell responses.  Standard apoptosis elicited by a range of other therapeutics however, is often non-immunogenic.  Chemotherapies can induce lymphopaenia which may have both negative and positive effects on anti-tumor immunity, including loss of anti-tumor effector T cells as well as negative regulatory T cells and myeloid derived suppressor cells (MDSC).

In the recent January issue of Nature Medicine, Bruchard et. al., demonstrate that the widely prescribed chemotherapeutic agents, gemcitabine and 5-fluorouracil (5-FU) activated the NLRP3 (NOD-like receptor family, pyrin domain containing-3) inflammasome complex in MDSCs, leading to perturbed anti-tumor immunity and reduced therapeutic effect of these drugs.

The NLRP3 inflammasome is activated in response to damage associated molecular patterns (DAMPs) released during infection with a plethora of pathogens.  NLRP3 activation leads to formation of the multi-protein inflammasome complex that activates caspase-1.  IL-1b is a pro-inflammatory cytokine that is transcribed as an inactive pro-peptide and requires processing by caspase-1 into its active secreted form, and is a major inflammasome effector molecule.

In the study by Bruchard et. al., gemcitabine and 5-FU activated the NLRP3 inflammasome complex in MDSCs, and led to characteristic activation of caspase-1 and IL-1b.   In contrast, the chemotherapeutics Deticene, taxol, oxaliplatin, mitomycin C, and doxorubicin did not activate this pathway.  Cathepsin B release from damaged lysosomes into the cytosol was shown as the trigger of NLRP3 activation by gemcitabine and 5-FU.  Importantly, increased serum concentrations of IL-1b, and enhanced caspase-1 and cathepsin B activity in circulating MDSCs were found colorectal cancer patients one day after 5-FU treatment, validating the relevance of these observations.

Studies on the subset of CD4+ T helper cells that produce IL-17 (TH17) have demonstrated both positive and negative roles for these cells in cancer pathogenesis, and the contexts by which TH17 cells can play opposing roles is unclear.  In this study, IL-1b released by MDSCs treated with 5-FU promoted differentiation of CD4+ T cells into TH17 cells.  5-FU treatment promoted IL-17 production in PBMCs from colorectal cancer human patients as well.  Mice lacking inflammasome components or IL-17 demonstrated enhanced survival when treated with 5-FU.  Thus, in mice, 5-FU elicited TH17 cells play a pro-tumorigenic role.  Whether or not 5-FU elicited TH17 cells also promote tumor growth in human patients is a critical question to be addressed.

Finally, treatment of mice with the soluble form of IL-1Ra blocked the effects of IL-1b and promoted the anti-tumor effects of 5-FU.  Therefore, IL-1b blockade represents a rational immunotherapeutic strategy to enhance the effects of 5-FU and gemcitabine chemotherapies.

In conclusion, this study identified key mechanisms of immune modulation by gemcitabine and 5-fluorouracil in murine models and human cancer patients.  Chemotherapeutics elicit cellular damage by many different mechanisms, and understanding how each drug interacts with the immune system will be important for promoting critical synergy between chemotherapies and anti-tumor immunity.

Further Reading:

Chemotherapy-triggered cathepsin B release in myeloid-derived suppressor cells activates the Nlrp3 inflammasome and promotes tumor growth.  Bruchard M, Mignot G, Derangère V, Chalmin F, Chevriaux A, Végran F, Boireau W, Simon B, Ryffel B, Connat JL, Kanellopoulos J, Martin F, Rébé C, Apetoh L, Ghiringhelli F. Nat Med. 2013 Jan;19(1):57-64.

Immunological aspects of cancer chemotherapy. Zitvogel, L., Apetoh, L., Ghiringhelli, F. & Kroemer, G. Nat. Rev. Immunol. 8, 59–73 (2008).

Dual role of immunomodulation by anticancer chemotherapy.  Shurin MR.  Nat Med. 2013 Jan;19(1):20-2.

Inflammasomes and their roles in health and disease.  Lamkanfi M, Dixit VM. Annu Rev Cell Dev Biol. 2012;28:137-61.

5-Fluorouracil selectively kills tumor-associated myeloid-derived suppressor cells resulting in enhanced T cell–dependent antitumor immunity. Vincent, J. et al. Cancer Res. 70, 3052–3061 (2010).

Gemcitabine selectively eliminates splenic Gr-1+/CD11b+ myeloid suppressor cells in tumor-bearing animals and enhances antitumor immune activity. Suzuki, E., Kapoor, V., Jassar, A.S., Kaiser, L.R. & Albelda, S.M. Clin. Cancer Res. 11, 6713–6721 (2005).

Restoration of antitumor immunity through selective inhibition of myeloid derived suppressor cells by anticancer therapies. Apetoh, L., Vegran, F., Ladoire, S. & Ghiringhelli, F. Curr. Mol. Med. 11, 365–372 (2011).

2013 Conferences in Tumor Immunology and Cancer Immunotherapy


Tumor Invasion and Metastasis

January 20 – 23, 2013

Omni San Diego Hotel, San Diego, CA

Online registration is closed, but attendees may register onsite on at the conference registration desk on a first-come, first-served basis beginning from Sunday, January 20 at 4:00 p.m.


Keystone Symposia: Cancer Immunology and Immunotherapy

January 27 – February 1, 2013.

Fairmont Hotel Vancouver, Vancouver, British Columbia, Canada.

Registration is still open until January 27, 2013.


Keystone Symposia: Antibodies as Drugs

January 27 – February 1, 2013.

Fairmont Hotel Vancouver, Vancouver, British Columbia, Canada.

Abstract submission is closed. Registered attendees can bring a poster onsite.

Registration is still open online.


Global Technology Community: The 2nd Novel Immunotherapeutics Summit

January 30 – February 1, 2013.

The Westin Gaslamp Quarter, San Diego, California, USA.

The summit includes a pre-summit workshop and 4 concurrent tracks.

Abstracts can be submitted online, and registration is available for Workshop alone, the Workshop + the Immunotherapetics & Immunomonitoring Track, or the entire Summit.

**Purchase an All Conference Pass for attendance to ALL Global Technology Community Conferences for One Year for $3,995 ($1,990 for Acad/Govt)**

Workshop: Immune Responses in Tumor Microenvironment

January 30, 2013.  This is a half day workshop.

Track: 5th Immunotherapeutics & Immunomonitoring

Track: 11th Cytokines & Inflammation

Track: 2nd Allergy & Respiratory Drug Discovery

Track: Immunogenicity & Immunotoxicity


2013 Tumor Immunology Lab Symposium: Tumor vs Immune System: A Cytokine Battle!

February 6, 2013.

Radboud University Nijmegen Medical Centre, Nijmegen, Netherlands.

Registration is Free, however limited to 150 attendees!


First Symposium of the Cancer Research Center of Lyon

February 13 – 15, 2013.

Convention Center, Lyon, France.

Online registration deadline: February 3, 2013.


Global Technology Community: 2nd Novel Cancer Therapeutics Summit

February 25 – 26, 2013.

Palms Casino Resort / Palms Place, Las Vegas, Nevada, USA.

Abstracts and registration can be submitted online.


IMMUNO 2013: 10th International Conference on New Trends in Immunosuppression and Immunotherapy

March 11 – 12, 2013.

Hotel Fira Palace, Barcelona, Spain.

Registration is still open online.


Arrowhead’s 2nd Annual Cancer Immunotherapy Conference: Stem Cells and Cancer Immunotherapy

April 4-5, 2013

The Washington Post Conference Center, Washington, D.C., USA.

Abstract submissions are due by March 10, 2013 to: poster@arrowheadpublishers.com

Registration and application for Speaking Opportunities can be done online.


Global Technology Community: Cancer Immunotherapy and Immunomonitoring Conference

April 22 – 25, 2013.

Hilton Garden Inn, Krakow, Poland.

Abstracts and registration can be submitted online.


Cancer Immunotherapy Consortium 2013 Scientific Colloquium: Entering the Era of Combination Therapies: Practical Implementation

April 25-27, 201.

Willard Intercontinental, Washington, DC, USA.

Early Registration Deadline: March 15, 2013.


Roche – Nature Medicine Imunology Symposium 2013: Host Immunity to Cancer and Chronic Viral Infections

April 28–30, 2013.

Roche Forum, Buonas, Switzerland.

This is a closed symposium.  Only 50 attendees will be selected to participate in addition to the invited speakers.  Applications for attendance and abstracts can be submitted online.

Application & Abstract Submission Deadline: February 21, 2013.


T cell Function and Modulation Meeting

April 28 – May 1, 2013.

Makena Beach & Golf Resort, Maui (Makena), HI.

Registration can be submitted online and is limited to the first 125 attendees.


CIMT Annual Meeting

May 14 – 16, 2013.

Rheingoldhalle Congress Center, Mainz, Germany

The Association for Cancer Immunotherapy (CIMT) Annual Meeting is the largest meeting in Europe focused on research and development in cancer immunotherapy.

Abstract submission deadline: March 15, 2013.

Early Registration deadline: March 15, 2013.


Cold Spring Harbor Asia Conference: Tumour Immunology and Immunotherapy

October 28 – November 1, 2013.

Suzhou Dushu Lake Conference Center, Suzhou, China.

Abstract submission deadline: August 16, 2013.

Early Registration deadline: August 16, 2013.


Websites that list upcoming Conferences & Events in Immunology, Tumor Immunology, and Cancer Immunotherapy:


The American Association of Immunologists (AAI) Meetings and Events Calendar

Nature Reviews Immunology’s list of conferences

Cancer Immunity Journal’s List of Conferences


High Throughput Systems for Maximizing Human PBMC Assay Potential

Humans are a heterogeneous population and studies comparing populations of humans require a high number of samples for statistical validity.  In addition, human samples such as PBMC are precious in that they represent the immune state of an individual at a point in time.  Thus, when studies are done to analyze a particular state of the immune response in individuals, such as pre- versus post-vaccination, or along the course of a disease state, once used, the samples can never be replaced.  To make the most of human PBMC samples, in particular when patient samples are being used, it is important to not only carefully optimize assays, but additionally be able to maximize the questions that can be addressed with these samples.

Having recently completed a large study involving human patient PBMCs, I encourage the use of high throughput assays systems that allow for a streamlined experimental approach.  All of these assays involve 96-well plate based methods and commercially available kits.


Basic Equipment for 96-well Plate Assays:

Multichannel Pipettes are necessary for quickly performing all 96-well plate assays.  These come in p1000, p200, p20, and p2 volumes.

96 well plate96-well Plates:  Different types of 96-well plates are available for different assay types.  There are various surface coatings including tissue-culture treated polystyrene for cell cultures, uncoated, and others.  Plates can have various plate bottom geometries and optical characteristics.  For instance there are black plates available for light-sensitive assays.  For protocols involving volumes larger then 250ul, there are deep-well plates that carry a 2ml volume per well.

VPscientific multichannelMultichannel Vacuums: Companies such as V&P Scientific offer a multitude of multichannel vacuum manifolds that fit plates of different depths for removing supernatant from wells via vacuum apparatus.  Often these will be the proper length such that they don’t touch the well bottom and work well with removing buffers from centrifuged PBMC cell cultures, such as during washing steps for flow-cytometry.

http://www.vp-scientific.com/wands_&_manifolds.php


PBMC subset Purification:  For magnetic bead based purification of PBMC populations of interest, Stem Cell Technologies offers a 96-well plate EasyPlate™ EasySep™ Magnet that allows separation of up to 1 x 10⁷ cells per well.  Currently only negative or untouched cell isolation methods are supported by this magnetic system due to the larger size of the magnetic beads used in Stem Cell Technologies’ negative isolation kits compared with positive isolation kits.

http://www.stemcell.com/en/Products/All-Products/EasyPlate-EasySep-Magnet.aspx


RNA Isolation:  Qiagen offers two kits for 96-well purification of total RNA from cells.  The RNeasy 96 Kit and RNeasy Plus 96 Kit.  These are 96-well column based platforms which require either a Qiagen vacuum manifold or specialized centrifuge for the protocol.  The RNeasy 96 Kit and RNeasy Plus 96 Kit are similar with the RNeasy Plus 96 Kit utilizing an extra set of steps and columns for elimination of genomic DNA.  The standard RNeasy 96 Kit protocol does however have an optional step for on-column DNAse digestion, however DNAse is not included in the kit.

RNeasy 96 Kit: http://www.qiagen.com/products/rnastabilizationpurification/rneasysystem/rneasy96.aspx

RNeasy Plus 96 Kit:http://www.qiagen.com/products/rneasyplus96kit.aspx


RNA Quantification is much easier if done by 96-well methods than one sample at a time.  Life Technologies’ Quant-iT™ RiboGreen® RNA Assay Kit is extremely sensitive but requires a fluorescence-plate reader.  Thermo Scientific now has a NanoDrop 8000 UV-Vis Spectrophotometer that quantifies nucleic acid concentrations from 96-well plates.

http://products.invitrogen.com/ivgn/product/R11490

http://www.nanodrop.com/productnd8000overview.aspx


In summary, systematic high-throughput protocols can be developed using 96-well systems such as these and many others.  Thus, numerous PBMC samples can be put through multiple experimental procedures in a streamlined manner, maximizing efficiency and minimizing experimental variation.  In this way, multiple questions can easily be simultaneously addressed in precious PBMC samples.

Markers for Identification of Regulatory T cells in Human PBMC

Forkhead box P3 (FoxP3)+ CD4+ T cells, known as regulatory T cells or TREGs, are a class of negative regulatory T cells that function to suppress immune responses, thereby establishing tolerance, preventing autoimmunity, and allowing tumor escapes from immune surveillance.   TREGs are thought to be generated by two major mechanisms.  Natural TREGs are generated through positive selection in the thymus via differential TCR signaling compared with conventional T cells.  Adaptive or converted TREGs are thought be generated in the periphery by conversion of conventional CD4+ T cells via various mechanisms.

TREGs are a heterogeneous population of T cells that function via cell-contact dependent and independent mechanisms to suppress various immune cell types.  Contact-dependent mechanisms of suppression include expression of negative regulatory receptors such as CTLA4, or killing of associated dendritic cells (DCs) through secretion of perforin and granzyme B.  Contact-independant mechanisms of suppression include TREGs secretion of immune suppressive cytokines including IL-10 and TGFb.   High expression of the IL-2 co-receptor CD25 allows TREGs to act as a sink for IL-2 thereby leading to IL-2 deprivation of conventional T cells and inhibition of proliferation.

TREGs are thus an important class of cells and study of these cell populations in human PBMC requires an understanding of the surface and intracellular markers that can be used for flow cytometry analysis and isolation by Fluorescence-activated cell sorting (FACS) or other methods.

Miyara et. al. identified three functionally unique FoxP3+ populations in  freshly isolated CD4+ T cells from human PBMC.  These three populations could be identified by flow cytometry staining of CD45RA, FoxP3, and CD25.  CD25 and FoxP3 expression were highly correlated in the CD4+ population, and I have consistently seen this in my own analyses of unstimulated human PBMC.  The three populations included CD45RA+FoxP3low cells which were CD25++, CD45RAFoxP3high cells which were CD25+++, and CD45RAFoxP3low cells which were CD25 ++.  When these populations were FACS sorted based on CD45RA and CD25 expression, only CD45RA+CD25++ and CD45RACD25+++ cells were functionally suppressive in co-culture experiments with TCR-activated CD25CD45RA+CD4+ responder T cells.  Thus CD45RA+FoxP3lowCD25++ cells and CD45RAFoxP3highCD25+++ cells were denoted as naïve/resting and effector/activated TREGs, respectively.  CD45RAFoxP3low cells in contrast, are likely a heterogeneous mixture of cells and include some cells able to produce IFNg, IL-17, and IL-2 upon PMA+ ionomycin stimulation.  Because dividing effector T cells are able to transiently express FoxP3 at low levels, these cells are likely to be contained in the CD45RAFoxP3low population.  Thus, when using CD25 or FoxP3 to identify TREGs by flow cytometry, CD45RA should be included, and care must be taken with the gating strategies.

Treg Identification FoxP3 CD25 CD45RA resized 600

CD25 in combination with TNFR2 and/or the lack of expression of CD127 have been shown to identify FoxP3+ TREGs that are highly suppressive even in CD25low populations and thus may be excellent markers in particular for FACS sorting of TREGs for functional analyses wherein FoxP3 cannot be utilized as a selection marker.

Several other markers have been used to delineate different populations of TREGs.  The intracellular inhibitory receptor CTLA4, the co-stimulatory receptor ICOS, and the MHC class II cell surface receptor HLA-DR, are co-expressed with FoxP3 in the CD45RAFoxP3high TREG population and may be utilized as specific markers of that population.

Depending on the assay conditions, additional markers may be used to identify TREGs.  LAP, CD121a, and CD121b have been noted as highly specific markers of TREGs but are not expressed in the resting state, becoming transiently induced under assay conditions utilizing TCR stimulation.

This is by no means an exhaustive list of markers that have been used to identify human TREGs in their various functional subsets and states.  The 2011 review in Int Immunopharmacol. by Chen et. al. discusses the usage of these and other markers including CCR6, LAG-3, GARP, CD103, CD39, and CD49d.

In summary, there are multiple combinations of markers that can be used to identify functionally different TREG populations within human PBMC.  The selection of these markers should be considered in the context of the assay type being done and the questions being asked about these heterogeneous populations of cells.

Further Reading:

Regulatory T cells: mechanisms of differentiation and function.  Josefowicz SZ, Lu LF, Rudensky AY.  Annu Rev Immunol. 2012;30:531-64.

Foxp3+ regulatory T cells: differentiation, specification, subphenotypes.  Feuerer M, Hill JA, Mathis D, Benoist C. Nat Immunol. 2009 Jul;10(7):689-95.

Functional delineation and differentiation dynamics of human CD4+ T cells expressing the FoxP3 transcription factor.  Miyara M, Yoshioka Y, Kitoh A, Shima T, Wing K, Niwa A, Parizot C, Taflin C, Heike T, Valeyre D, Mathian A, Nakahata T, Yamaguchi T, Nomura T, Ono M, Amoura Z, Gorochov G, Sakaguchi S.  Immunity. 2009 Jun 19;30(6):899-911.

Resolving the identity myth: key markers of functional CD4+FoxP3+ regulatory T cells.  Chen X, Oppenheim JJ. Int Immunopharmacol. 2011 Oct;11(10):1489-96.

A peripheral circulating compartment of natural naive CD4 Tregs. D. Valmori, A. Merlo, N.E. Souleimanian, C.S. Hesdorffer, M. Ayyoub.  J. Clin. Invest., 115 (2005), pp. 1953–1962.

Activation-induced FOXP3 in human T effector cells does not suppress proliferation or cytokine production.  Allan SE, Crome SQ, Crellin NK, Passerini L, Steiner TS, Bacchetta R, Roncarolo MG, Levings MK. Int Immunol. 2007 Apr;19(4):345-54.

CD127 expression inversely correlates with FoxP3 and suppressive function of human CD4+ T reg cells.   W. Liu, A.L. Putnam, Z. Xu-Yu, G.L. Szot, M.R. Lee, S. Zhu, P.A. Gottlieb, P. Kapranov, T.R. Gingeras, B. Fazekas de St Groth et al.  J. Exp. Med., 203 (2006), pp. 1701–1711

Co-expression of TNFR2 and CD25 identifies more of the functional CD4+FOXP3+ regulatory T cells in human peripheral blood.  Chen X, Subleski JJ, Hamano R, Howard OM, Wiltrout RH, Oppenheim JJ.  Eur J Immunol. 2010 Apr;40(4):1099-106.

Identification of human stem cell-like memory T cells in PBMC

Memory T cell populations are heterogeneous in phenotype and function and many questions remain as to the mechanisms mediating their long term persistence.  Recent research by several groups have described populations of antigen-experienced T cells within human peripheral blood mononuclear cells (PBMC) that exhibit stem cell-like characteristics: increased self-renewal capacity and the ability to derive the more differentiated central and effector memory and effector populations in vitro and in vivo, and may thus be the cell type mediating memory T cell persistence.

In 2011, Gattinoni et. al. identified a population of stem cell-like memory T cells (TSCM) with surface markers characteristic of naive T cells in human PBMCs.   TSCM cells were CD45RO, CCR7+, CD45RA+, CD62L+, CD27+, CD28+ and IL-7Ra+.  The TSCM population comprised 2-3% of CD8+ and CD4+ T cells in healthy donors.  These TSCM cells could be differentiated from naïve T cells by high expression of CD95 and IL-2Rb, markers which are also expressed by memory T cells.  Furthermore, the TSCM population exhibited a gene expression profile that was intermediate between naïve (TN) and central memory (TCM) cells.

Like memory T cells, these TSCM cells were antigen-experienced and exhibited rapid effector activity upon T cell receptor (TCR) stimulation.  Importantly, they also exhibited the stem-like property of self-renewal in the presence of homeostatic IL-15 signals.  Following TCR stimulation, TSCM cells could differentiate into TCM and effector memory (TEM) T cell subsets, and the authors demonstrated a progressive differentiation pattern of TN à TSCM à TCM à TEM, where no differentiation in the opposite direction was observed following TCR stimulation of sorted TSCM, TCM, and TEM populations.  Human TSCM cells also survived significantly longer and produced more progeny in vivo then either TCM or TEM populations in a NOD.Cg-PrkdcscidIl2rgtm1Wjl/SzJ (NSG) mouse xenograft adoptive transfer model.

One of the most exciting clinical implications of this work however, was the demonstration that TSCM cells exhibited profoundly superior anti-tumor activity than either TCM or TEM  populations in a xenograft mouse tumor model where mesothelin-specific human T cell populations were transferred into NSG mice bearing human mesothelioma M108 tumors.  Thus, TSCM cells may be the most effective cellular subset for use in adoptive T cell therapy in cancer patients.

Subsequent to this finding, a paper was published by Lugli et. al., describing a protocol for identifying and isolating human TSCM cells from PBMCs as well as their in vitro expansion.  The flow cytometry staining panel proposed for TSCM cell identification includes antibodies targeting CD3, CD8, CD4, CD45RO, CCR7, either CD62L, CD27, CD28 or CD45RA, and CD95CD58 and CD122 (IL-2Rb) were also proposed as additional markers for better differentiation of TSCM cells from naïve populations which express these at lower levels.

Identification of human stem cell-like memory T cells in PBMC


Interestingly, the naïve-like TSCM population described by Gattinoni et. al. is not the only memory T cell population demonstrated to have “stem-like” characteristics.

In a quest to understand the mechanism by which patients who have undergone multiple rounds of cytotoxic chemotherapy induced lymphopenia maintain resistance to viral infections, Turtle et. al. described a population of human PBMC CD8+ T cells within the central and effector memory populations that were distinguished by expression of high levels of IL-18Rα and the natural killer (NK) cell receptor CD161.  These cells exhibited a hematopoietic stem cell-like capacity to efflux chemotherapeutic agents mediated by expression of ABCB1, survive chemotherapy, and replenish the virus-specific memory T cell pool in acute myeloid leukemia (AML) patients.

Human memory TH17 cells also have stem cell-like characteristics.  Despite their effector memory-like surface marker phenotype being CD45RO+ CCR7CD62L, compared with TH1 and TH2 subsets, TH17 cells were shown to have increased capacities for proliferation, in vivo persistence, resistance to apoptosis, and higher expression levels of stem-cell associated genes HIF1a, Notch, Bcl2, OCT4, and Nanog.  TH17 cells were able to differentiate into TH1 and TREG subsets.  TH17 cells also express CD161 and thus may overlap with Turtle et. al.’s CD161+ABCB1+ stem-like memory cells.

However, conflicting evidence has been presented as to the identity of CD161+ IL-17 expressing cells and whether or not these cells are in fact Vα7.2+ mucosal associated invariant T cells (MAITs) which are selected by nonpolymorphic MHC class Ib molecules.  MAIT cells however are not known to be virus-specific whereas the CD161+ABCB1+ stem-like memory population identified by Turtle et. al. included influenza and EBV-specific populations.  Thus much remains to be clarified regarding the overlap between CD161+ABCB1+ stem-like memory populations, IL-17 expressing CD4+ (TH17) and CD8+ (TC17) cells which also express CD161, and CD161+ IL-17 expressing MAIT cell populations.

In summary, the ability to identify various stem-like memory CD4 and CD8 human T cell populations in human PBMC using flow cytometry allows for many questions to be addressed about the phenotype, functions, and clinical applications of these cells.

.

Further Reading:

A human memory T cell subset with stem cell-like properties.  Gattinoni L, Lugli E, Ji Y, Pos Z, Paulos CM, Quigley MF, Almeida JR, Gostick E, Yu Z, Carpenito C, Wang E, Douek DC, Price DA, June CH, Marincola FM, Roederer M, Restifo NP. Nat Med. 2011 Sep 18;17(10):1290-7.

Identification, isolation and in vitro expansion of human and nonhuman primate T stem cell memory cells.  Lugli E, Gattinoni L, Roberto A, Mavilio D, Price DA, Restifo NP, Roederer M. Nat Protoc. 2012 Dec 6;8(1):33-42.

A distinct subset of self-renewing human memory CD8+ T cells survives cytotoxic chemotherapy.  Turtle CJ, Swanson HM, Fujii N, Estey EH, Riddell SR. Immunity. 2009 Nov 20;31(5):834-44.

Human TH17 cells are long-lived effector memory cells.  Kryczek I, Zhao E, Liu Y, Wang Y, Vatan L, Szeliga W, Moyer J, Klimczak A, Lange A, Zou W. Sci Transl Med. 2011 Oct 12;3(104):104ra100.

Human MAIT cells are xenobiotic-resistant, tissue-targeted, CD161hi IL-17-secreting T cells.  Dusseaux M, Martin E, Serriari N, Péguillet I, Premel V, Louis D, Milder M, Le Bourhis L, Soudais C, Treiner E, Lantz O. Blood. 2011 Jan 27;117(4):1250-9. doi: 10.1182/blood-2010-08-303339. Epub 2010 Nov 17.

CD161-expressing human T cells.  Fergusson JR, Fleming VM, Klenerman P. Front Immunol. 2011;2:36. doi: 10.3389/fimmu.2011.00036.

Using Phospho-Flow Cytometry to Study Signaling in Human PBMCs

One thing that every immunologist agrees on is that immune cells are heterogeneous, and human peripheral blood mononuclear cells (PBMC) contain many different immune cell types.  CD4+ T cells alone exist in dozens of uniquely functioning subsets.  Receptor mediated signal transduction events in response to signals such as cytokines, chemokines, various receptor ligands, and engagement of the T cell or B cell receptors represent an important aspect of immune cell communication and the many types of immune cells present in human PBMC are differentiated by these responses.  Trying to derive mechanisms from averages of complex PBMC populations obscures the understanding of the relationships that occur between expression of proteins and signaling states in unique cell populations and on the single cell level.

Dr. Gary Nolan and colleagues pioneered a method using flow cytometry to look at cell signaling in single cells using antibodies targeting phosphorylated protein sites, termed phospho-flow cytometry or “phosflow”.  In phosflow, PBMCs or other cell populations are stimulated with signaling receptor ligands and/or antagonists for a period of time.  Then the cells are fixed using paraformaldehyde-based buffers to lock the cells in their induced states of phosphorylation.  The cells are then permeabilized and stained with fluorescently-labeled antibodies against the phosphorylated proteins, antigens to identify cell populations, and other proteins of interest, and analyzed on a flow cytometer.

Using this method, our lab has assessed the response to many cytokines by analyzing phosphorylation of the STAT family of transcription factors, as well as phosphorylation events that occur downstream from T cell receptor (TCR) and B cell receptor (BCR) engagement, and Toll-like receptor ligation, such as NF-kB (p65), ERK, p38, and ZAP70BD Biosciences is a key resource for many of the reagents needed to perform these assays, providing several different buffers and antibodies against many important signaling targets.

LPS Monocytes p38 Phosflow resized 600

There are several considerations for optimizing this protocol.  The first is selecting the proper permeabilization method.  Nolan and colleagues published a protocol in which 100% methanol is used for permeabilization following fixation, and this is the method I have used most frequently.  One key advantage with this method is that following methanol permeabilization, the cells can be stored for an extended period of time at -20ºC or -80ºC prior to staining with the antibodies and running the flow cytometry.  Thus, many samples can be stimulated on different days, but the flow cytometry analysis can be performed later in a large batch, in order to limit the variability between staining intensities that can otherwise occur between experiments.  This is very important because when analyzing phosflow data, the fluorescence intensities which translate to magnitude of the phosphorylation of the protein target is often the key factor being analyzed, although the percentage of cells able to respond to a given signal can also be an important parameter for analysis.  However, there are a number of commercially available buffer sets for these assays which should be selected based on the phospho-proteins and other antigens of interest.

Another important factor to consider when setting up these assays is selection of the target antigens for identifying cell populations of interestSome antigens do not survive permeabilization with some of these reagents, including methanol.  For instance, I have had poor luck trying to identify B cells using CD19 or monocytes using CD14. CD20 and CD33 have been used respectively as alternatives that work well with methanol.

Cytobank, an online resource dedicated to phosflow created by Gary Nolan’s lab, is great for assisting in selecting the proper antigens and antibody clones for phosflow.  This website lists antibodies, including the phospho-target antibodies, that have been successfully and unsuccessfully tested with BD Biosciences’ various permeabilization buffers.

In summary, phosflow is an excellent method for analyzing signal transduction events in complex cell populations.  Using single cell assays for studies on protein expression and signaling will drive our understanding of the immune system’s complexity to the next level.


Nolan lab Phosflow protocol:

Single-cell phospho-protein analysis by flow cytometry. Schulz KR, Danna EA, Krutzik PO, Nolan GP.Curr Protoc Immunol. 2012 Feb;Chapter 8:Unit 8.17.1-20.


BD Biosciences Phosflow Homepage:

http://www.bdbiosciences.com/research/phosflow/index.jsp?WT.ac=FP_Phosflow


Cytobank’s list of antibodies tested with various permeabilization buffers:

http://www.cytobank.org/facselect/


Further Reading:

Flow cytometric analysis of cell signaling proteins. Suni MA, Maino VC.  Methods Mol Biol. 2011;717:155-69.

Single-cell, phosphoepitope-specific analysis demonstrates cell type- and pathway-specific dysregulation of Jak/STAT and MAPK signaling associated with in vivo human immunodeficiency virus type 1 infection.  Lee AW, Sharp ER, O’Mahony A, Rosenberg MG, Israelski DM, Nolan GP, Nixon DF. J Virol. 2008 Apr;82(7):3702-12.


Identification of CD4+ TH1, TH2, and TH17 populations in human PBMC

T cells present in human peripheral blood mononuclear cells (PBMC) are complex populations of different subtypes with unique functions.  CD4+ and CD8+ T cells are most simply classified as naïve, central memory, effector memory, and terminally differentiated effector subtypes, and T cells are currently thought to differentiate along this progression path following antigen experience.  In a previous post, I discussed using CD3, CD4, CD8, CD45RA or CD45RO, and CCR7 or CD62L as markers for differentiating T cells into these subtypes by multiparametric flow cytometry.

In addition, CD4+ T cells can be even further characterized as to their specific functions.  The cytokine milieu present during T cell activation through the T cell receptor (TCR) guides T cells to differentiate into memory and effector T helper subtypes (TH) including TH1, TH2, and TH17 subsets, all of which are present in PBMC.

Each of these TH subtypes functions by expressing a unique set of cytokines and chemokine receptors in order to elicit specific responses in different tissue settings.  It is important to note that memory T cells maintain flexibility in their functionality and can be re-polarized into different subtypes if re-stimulated under an alternate TH inducing condition.

Using multiparametric flow cytometry, each of these TH subsets can be identified by expression of specific cytokines, transcription factors, and surface markers including chemokine receptors, although the various markers used in the literature to classify the same subset do not overlap entirely. Identification of TH subsets by surface markers simply requires surface staining and is the easiest assay to perform.  Transcription factor expression can be assessed, which requires intracellular/nuclear permeabilization protocols such as BD Biosciences’ FoxP3 Buffer Set.  Finally, intracellular cytokine production can be detected following TCR stimulation with anti-CD3 and anti-CD28 antibodies or the combination of Phorbol 12-Myristate 13-Acetate (PMA) and the Ca2+ ionophore, ionomycin.  This generally requires 4-6 hours of stimulation in the presence of protein transport inhibitors: either brefeldin A or monensin, which are optimal for different cytokines.

TH1 cells promote cellular immunity against viruses and intracellular bacteria.  TH1 cells have been characterized in many ways.  Production of IFNg following TCR stimulation is probably the most common and direct functional representation to assess TH1 in PBMC.   Alternatively, the expression of the chemokine receptors CXCR3 and CCR5 have been associated with TH1 but not TH2 or TH17 cells.  The transcription factor T-bet (TBX21) is the major factor regulating TH1 differentiation and is also a marker of TH1 cells that can be assessed by flow cytometry, although T-bet expression is promiscuous and can be expressed in TH17 cells.  Interestingly, expression of any of these markers may not overlap entirely with IFNg expression.  For instance, in central memory T cells, CXCR3+ cells are considered pre-TH1 cells and do not express IFNg, while in the effector memory population, a fraction of CCR5+ and CXCR3+ cells express IFNg.  As always, care must be taken when making comparisons between percentiles and functions of populations identified using different markers.

TH2 cells are the CD4 helper subtype that promotes immunity against extracellular pathogens and are involved in allergic inflammation.  TH2 cells in PBMC can be classified by production of TH2-specific cytokines including IL-4, IL-5, and IL-13 following TCR stimulation or PMA/ionomycin.  However, expression of these cytokines can be difficult to detect and expression of the surface receptors CRTH2, CCR4, or CCR3 are alternatives.  Again, expression of CRTH2, CCR4, or CCR3 does not mark all existing IL-4, IL-5, and IL-13 expressing TH2 cells and vice versa, although CRTH2 has been demonstrated to be quite effective.

TH17 cells are known as the subtype associated with inflammatory autoimmune diseases and protection from fungal infections.  TH17 cells are classified by expression of IL-17 or surface marker expression, being CCR6+CCR4+.   Expression of the TH17-specific transcription factor RORg/gt can also be assessed.  A fraction of IL-17 expressing cells can also express IFNg and TH17 associated markers CCR6 and RORg/gt. Some have even suggested that IL-17+IFNg+ cells are a transitional state when more plastic TH17 cells differentiate into effector TH1 cells.

As cytokine expression may be the most discrete method of describing a TH cell regarding its function, I have used cytokine expression as a measure of TH1 and TH17 cells in human PBMC.  However in the case of TH2 cells, expression of IL-4 and IL-13 was hard to detect by flow cytometry, even with PMA and ionomycin stimulation and thus I have instead utilized CRTH2.  The protocol that I have optimized for identification of TH1, TH2, and TH17 cells involves a 4 hour stimulation of PBMCs with anti-CD3 and anti-CD28 antibodies or with PMA + ionomycin in the presence brefeldin A.  Following this, I first stain for surface markers including CRTH2 to identify TH2 cells.  Then the cells are fixed and permeabilized using BD Biosciences’ Cytofix Cytoperm buffer set and stained for IFNg (TH1) and IL-17 (TH17).  Using this method I have never seen co-expression for any of these factors with the exception of a small population of cells that co-stain with IFNg and IL-17, as commonly described in the literature.

CD4 TH1 TH2 TH17  human PBMC resized 600

Taken together, selection of markers for assessing these populations must be done carefully, bearing in mind that cytokines characteristic of a TH subtype are not always co-expressed in all cells identified as that TH subtype by the surface markers and transcription factors discussed here.  Flow cytometry panels containing markers for all of these TH subtypes can allow measurement of more specific TH populations from PBMC by gating based on specific expression as well as exclusion of the other TH subtype markers.


Additional Reading

Heterogeneity of CD4+ memory T cells: functional modules for tailored immunity.  Sallusto F, Lanzavecchia A. Eur J Immunol. 2009 Aug;39(8):2076-82.

Chemokine receptor expression identifies Pre-T helper (Th)1, Pre-Th2, and nonpolarized cells among human CD4+ central memory T cells.  Rivino L, Messi M, Jarrossay D, Lanzavecchia A, Sallusto F, Geginat J. J Exp Med. 2004 Sep 20;200(6):725-35.

Human T cells that are able to produce IL-17 express the chemokine receptor CCR6.  Singh SP, Zhang HH, Foley JF, Hedrick MN, Farber JM. J Immunol. 2008 Jan 1;180(1):214-21.

Selective expression of a novel surface molecule by human Th2 cells in vivo.  Nagata K, Tanaka K, Ogawa K, Kemmotsu K, Imai T, Yoshie O, Abe H, Tada K, Nakamura M, Sugamura K, Takano S. J Immunol. 1999 Feb 1;162(3):1278-86.

Tricks for analyzing PBMC populations by flow cytometry

Flow cytometry allows assessment of protein expression on a single cell level.  Because of the diversity of populations comprising peripheral blood mononuclear cells (PBMC), flow cytometry represents the best method for studying the functional and phenotypic properties of these cell subsets.  There have been a number of publications that present multiparametric flow cytometry staining panels for assessing PBMC populations, and as an easy first step into these assays, these panels can be referenced (see a few examples below).

However, use of these established panels may not suit further exploratory questions, and thus an understanding of the best methods for designing flow cytometry panels is needed.  Because of the many identified populations and the upper limits of markers that can be simultaneously used in flow cytometry, a lot of thought must go into planning these assays.

Flow cytometry utilizes fluorophore-conjugated antibodies targeting antigens of interest.  Antigenic markers uniquely present on PBMC population subsets have been actively sought after by the immunology community. The upper limit of the number of markers that can be simultaneously assessed depends on several parameters.  Most obviously, this depends on the specs of the flow cytometer instrument available.  I presently use a modified version of the BD LSR Fortessa, with five lasers, and allowing detection of up to 17 parameters plus forward and side scatter.

Unfortunately, because of overlap in the excitation and emission spectrums of available fluorophores, this doesn’t mean that I am able to successfully co-analyze 17 PBMC markers.  The fluorescence emitted from a given fluorophore may be detected or “spill over” into the range of detectors optimized for other fluorophores.  Although flow cytometry software is capable of calculating the percent spillover from this spectral overlap and subtracting this estimated fluorescence from the affected channels by a process known as compensation, this is not a perfect science. Due to spectral overlap, there are a few points to consider when designing an antibody “staining panel” for your immunological assessments.

First, select the fluorophores you hope to use in your panel.  To do this, determine the laser and detector configurations of your cytometer.  This will tell you for which fluorophores the excitation and emission spectrums are optimal on your instrument.

Next, choose detection channels to try first based on minimal excitation and emissions overlap.  Alternatively, consult previously published panels to see which fluorophore combinations have been recommended.  As an example, for my instrument’s 561nm laser, there are 5 detectors, so if I had to choose 3 of these, it would simply be every-other one based on the detector’s spectral range.  However, fluorophores can overlap in not only their emission but also their excitation spectrums.  Thus, it is important to look across the detectors for different lasers.  For instance on my instrument, there is a 780/60BP detector on the 561nm laser for detection of PE-Cy7, and the same detector on the 640nm laser for detection of APC-Cy7.   Thus the use of these channels together may be complicated if the fluorophores have a wide excitation range.  BD Biosciences has an awesome fluorescence spectrum viewer for envisioning the spill-over between parameters based on your cytometer configurations.  Other companies such as Life Technologies, eBioscience, and Biolegend also have similar tools to reference for fluorophores not sold by BD Biosciences.

It is important to mention that fluorophores are improving all the time.  Newer chemistries have led to development of product lines such as the Brilliant Violet dye series and Q-Dots with highly improved excitation and emissions spectrums for minimal spill-over.  Thus, for each channel, there could be several fluorophores that fit the optimal excitation and emission properties but select the one with optimal qualities of not only brightness but also their excitation and emission spectrums.

Once you have selected a likely handful of combinable fluorophores, it is time to figure out which cellular markers to target with which fluorophores.  To do this, first determine which markers of interest in your staining panel are co-expressed.  If there is no co-expression of your selected markers, it becomes easier to utilize antibodies tagged with spectrally overlapping fluorophores.  For instance, Pacific Blue and V500 have an approximately 10-20% spillover into the other’s channel on my LSR Fortessa’s configurations.  However, when not co-expressed, for instance CD4 and CD8, the fluorescent spill-over and hence compensation issues between these fluorophores are minimized, i.e. if there is no expression of Pacific Blue, then there is nothing to subtract from the V500 channel and vice versa.  However, if markers are co-expressed, such as CD4 and CD45RA, then issues with compensation between these parameters may lead to over or under-subtraction of fluorescence values in CD4+CD45RA+ populations compared with single positive populations.  But if your objective is only to gate these populations for analysis of other markers or to determine population percentages, then markers such as these may be successfully utilized together if these populations are visually discernible on cytometry data plots.  Another key thing to mention is for the lower expressing antigens, choose the brightest fluorophores.

But we’re not finished yet.  Next, determine for which markers your objective is to gain information about fluorescence intensity.  Now take the example from above but imagine that your question involved the magnitude of CD45RA expression on the CD4 versus CD8 population of PBMC T cells.  I have not done this example directly, but I can imagine that having high levels of compensation between one but not another parameter (in this case between CD4 and CD45RA but not between CD8 and CD45RA), may lead to inaccuracies in the relative fluorescence intensities.   Thus, in this example, if CD45RA is the marker for which expression intensity is the question, then the overlapping spectral fluorophores Pacific Blue and V500 would be best suited for identifying CD4 and CD8, while a fluorophore with minimal compensation issues with these channels, such as PE, would be best for CD45RA.  Thus, for markers in which determining fluorescence intensity is your objective, choose fluorophores with the least spectral overlap with all of the others in your panel.

PBMCAnalysisByFlowCytometryCD3CD4CD20 resized 600

Finally here’s another trick:  you can use two exclusively expressed markers in the same channel, as long as there is a third marker to differentiate these populations.  For example, I have very successfully used CD4-PerCP-Cy5.5 (CD4+ T cells) together with CD20-PerCP-Cy5.5 (B cells) along with CD3-V450 to differentiate the T cells from B cells in human PBMC.  In this case, CD4+ T cells will be double positive in V450 and PerCP-Cy5.5 channels, while CD20+ B cells will be PerCP-Cy5.5+ but V450, and CD8+ T cells will be PerCP-Cy5.5 and V450+.

In summary, multiparametric flow cytometry analysis of PBMCs can be tricky, but with these and other tricks up your sleeve it becomes much easier to successfully design panels optimal for the questions you are asking and to maximize the number of parameters in your flow cytometry staining panels.


Examples of established multiparametric flow cytometry panels:

Standardizing immunophenotyping for the Human Immunology Project.  Maecker HT, McCoy JP, Nussenblatt R.  Nat Rev Immunol. 2012 Feb 17;12(3):191-200.

Multiparameter flow cytometry monitoring of T cell responses.  Maecker HT.  Methods Mol Biol. 2009;485:375-91.

11-color, 13-parameter flow cytometry: identification of human naive T cells by phenotype, function, and T-cell receptor diversity.  De Rosa SC, Herzenberg LA, Herzenberg LA, Roederer M. Nat Med. 2001 Feb;7(2):245-8.

Nine-color flow cytometry for accurate measurement of T cell subsets and cytokine responses. Part I: Panel design by an empiric approach. McLaughlin BE, Baumgarth N, Bigos M, Roederer M, De Rosa SC, Altman JD, Nixon DF, Ottinger J, Oxford C, Evans TG, Asmuth DM. Cytometry A. 2008 May;73(5):400-10.


BD Bioscience’s Fluorescence Spectrum Viewer:

http://www.bdbiosciences.com/research/multicolor/spectrum_viewer/index.jsp

Basic markers of T cell populations in human PBMC

Human peripheral blood mononuclear cells (PBMC) are comprised of complex populations of T cells, B cells, NK cells, monocytes, and dendritic cells.  In addition, there are more complicated cell types such as NKT cells that are thought of as T cells that share many properties of NK cells.  Within all of these basic populations are many functionally unique subsets.  Because of the diversity of populations in PBMC, flow cytometry represents the best method for studying functional and phenotypic properties of these cell subsets.  In the next few blog posts, I will discuss selection of markers for studying PBMC populations using flow cytometry and the best way to arrange these markers in flow cytometry staining panels.

The PBMC cell type I have the most experience with characterizing is T cells.  CD3, a T cell specific marker, is necessary to differentiate T cells from other populations, simply because CD4 and CD8 can be expressed by other cell types.  CD8 can be expressed on NK cells, while CD4 can be expressed on populations of monocytes and dendritic cells.  CD4 and CD8 are also necessary markers for identification of these two major T cell populations.

CD4 and CD8 T cells are most simply classified as naïve or antigen experienced populations including central memory, effector memory and effectors.  Central memory and effector memory populations are known to differ in their effector functions and ability to home to different anatomical sites.  Two markers are necessary to differentiate naive, central memory, effector memory and effector T cell populations present in PBMC.

The first is CD45, a protein tyrosine phosphatase regulating src-family kinases, is expressed on all hematopoietic cells.  CD45 can be expressed as one of several isoforms by alternative splicing of exons that comprise the extracellular domain. CD45RA is expressed on naïve T cells, as well as the effector cells in both CD4 and CD8.  After antigen experience, central and effector memory T cells gain expression of CD45RO and lose expression of CD45RA.  Thus either CD45RA or CD45RO is used to generally differentiate the naïve from memory populations.

However, differentiation between central and effector memory populations and between naïve and effector populations can be achieved by adding a second marker.   There are several markers that have been used for this purpose and these tend to mark these populations at slightly different stages of the differentiation pathway that is thought to occur in T cells as they change from central to effector memory cells.  The chemokine receptor CCR7 is considered the gold standard for this discrimination, and the lymph node homing receptor CD62L is a close second choice.  Naïve and central memory cells express these receptors in order to migrate to secondary lymphoid organs, while the absence of these receptors allows for effector memory and effector cells to accumulate in peripheral tissues.  CCR7 has been classically thought to be difficult to stain for due to low expression levels, and as a result I have never used it.  However, a recent review article pointed out that a new brighter staining antibody to CCR7 has been developed (clone 150503), and is something I hope to test in the near future.  CD62L has generally been my marker of choice, however CD62L expression is lost following density gradient centrifugation, cryopreservation, TCR ligation or activation with PMA/ionomycin.  Thus CD62L as a marker is best utilized following overnight culturing subsequent to thawing cryopreserved cells.  Other potential markers are CD27 and CD28 which are also more highly expressed by the central memory and naive populations.  However, it is important to note that each of these markers, CCR7, CD62L, CD27, and CD28, marks slightly different populations of cells and care must be taken when making comparisons between populations defined by different markers for assessing frequencies or functions.

In summary, naïve T cells are CD45RA+CD45ROCCR7+CD62L+, central memory T cells are CD45RACD45RO+CCR7+CD62L+, effector memory T cells are CD45RACD45RO+CCR7CD62L, and effector cells are CD45RA+CD45ROCCR7CD62L.  Thus, CD3, CD4, CD8, CD45RA or CD45RO, and CCR7 or CD62L or CD27, are a great starting point for designing flow cytometry panels for the assessment of T cells present in human PBMC.  T cells populations, however, are much more complex, and may be further classified by helper subtypes and activation status, which will be discussed in a later blog.

describe the image

The use of CD45RA and CD62L to differentiate naive, central memory, effector memory and effector T cell populations present in PBMC.  Naïve CD4 and CD8 T cells are CD45RA+CD45ROCCR7+CD62L+ (B, F), central memory T cells are CD45RA- CD45RACD45RO+CCR7+CD62L+ (A, E), effector memory T cells are CD45RACD45RO+CCR7CD62L (C, G), and effector cells are CD45RA+CD45ROCCR7CD62L (D, H).


Further Reading:

Central memory and effector memory T cell subsets: function, generation, and maintenance.   Sallusto F, Geginat J, Lanzavecchia A. Annu Rev Immunol. 2004;22:745-63.