RORγt+ TREGS: A unique subset of TREGS that specifically promote Colorectal Cancer

tregThe role of CD4+ FoxP3+ regulatory T cells (TREGS) in colorectal cancer (CRC) has continued to be unclear.  TREGS act to suppress inflammatory mechanisms that are associated with tumor progression and can thus act to suppress the development of cancer.  However, TREGS also function to inhibit anti-tumor T cell responses, thereby promoting cancer escape from immune surveillance.  Many studies have been published on the frequencies of TREGS in the peripheral blood and tumors of CRC patients, but there is yet to be a consensus regarding the relationship between TREGS and disease outcome.  In a report by Blatner et. al, the expression of RORγt in a subset of CD4+ FoxP3+ T cells was found to specifically mediate pathogenic pro-tumor activity compared with RORγtCD4+FoxP3+ TREGS in CRC patients.

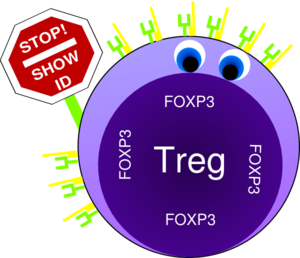
CD4+ FoxP3+ cells have been classified into three functional populations based on the expression of CD45RA and FoxP3: CD45RA+FoxP3int, CD45RAFoxP3int, and CD45RAFoxP3high.  The CD45RAFoxP3high population exhibits the most suppressive activity of these subsets.  In the study by Blatner et. al, the CD45RAFoxP3high population was found to be specifically expanded in peripheral blood mononuclear cells (PBMCs) and within the tumor of CRC patients and increased with cancer stage.  Because IL-17 expressing CD4+ FoxP3+ cells have been described in the gut and enhanced in patients with CRC and Crohn’s disease, the authors examined CD4+ FoxP3+ populations for expression of the TH17 transcription factor, RORγt. 

In CRC patients, a large fraction of all three subsets of TREGS in PBMCs and in the tumor were found to express RORγt.  Interestingly, when TREG populations were sorted from healthy donors versus CRC patients, CRC patient TREGS  retained suppressive activity over T cell proliferation but had lost their ability to suppress mast cell degranulation.  Expression of IL-17 was also found in a large percentage of CRC TREGS, in a fashion mutually exclusive from IL-10 expression.

To further explore the role of RORγt in CRC, APC∆468 polyposis-prone mice were crossed with mice deficient in RORγt.  RORγt-/-APC∆468 mice were highly resistant to polyp development, had reduced expansion of splenic proinflammatory macrophages, myeloid-derived suppressor cells (MDSCs) and polyp-associated mast cells, compared with RORγt+APC∆468 mice.  Interestingly, the effect of RORγt deficiency in APC∆468 mice was not phenocopied by the loss of IL-17.  Instead, although IL-17 deficiency reduced the frequency of polyps, mast cell recruitment to polyps was enhanced, and ultimately IL-17-/-APC∆468 mice developed invasive lesions.

Overall, this study revealed several fascinating points: CD4+FoxP3+RORγt+ cells appear to be a pathogenic TREG subset that have lost their anti-inflammatory properties and are specifically expanded in CRC patients where they assist in disease progression.  The function of RORγt was not synonymous with IL-17 in TREGS, indicating that other effects of RORγt contribute to the role of these cells in tumor pathogenesis.  Thus, the roles and relationships between FoxP3, RORγt, and IL-17 in TREGS deserve further attention in CRC pathogenesis.  Hopefully, a clearer understanding of this newly identified subset of RORγt+  TREGS and their role in CRC progression will enable much improved methodology for targeting specific TREGS populations in CRC and other disease settings.

Further Reading:

Expression of RORγt marks a pathogenic regulatory T cell subset in human colon cancer.  Blatner NR, Mulcahy MF, Dennis KL, Scholtens D, Bentrem DJ, Phillips JD, Ham S, Sandall BP, Khan MW, Mahvi DM, Halverson AL, Stryker SJ, Boller AM, Singal A, Sneed RK, Sarraj B, Ansari MJ, Oft M, Iwakura Y, Zhou L, Bonertz A, Beckhove P, Gounari F, Khazaie K. Sci Transl Med. 2012 Dec 12;4(164):164ra159. doi: 10.1126/scitranslmed.3004566.

Translational mini-review series on Th17 cells: induction of interleukin-17 production by regulatory T cells.  Afzali B, Mitchell P, Lechler RI, John S, Lombardi G. Clin Exp Immunol. 2010 Feb;159(2):120-30. doi: 10.1111/j.1365-2249.2009.04038.x. Epub 2009 Nov 11.

Inflammation-driven reprogramming of CD4+ Foxp3+ regulatory T cells into pathogenic Th1/Th17 T effectors is abrogated by mTOR inhibition in vivo.  Yurchenko E, Shio MT, Huang TC, Da Silva Martins M, Szyf M, Levings MK, Olivier M, Piccirillo CA. PLoS One. 2012;7(4):e35572. doi: 10.1371/journal.pone.0035572. Epub 2012 Apr 24.

In colorectal cancer mast cells contribute to systemic regulatory T-cell dysfunction.  Blatner NR, Bonertz A, Beckhove P, Cheon EC, Krantz SB, Strouch M, Weitz J, Koch M, Halverson AL, Bentrem DJ, Khazaie K. Proc Natl Acad Sci U S A. 2010 Apr 6;107(14):6430-5. doi: 10.1073/pnas.0913683107. Epub 2010 Mar 22.


Using Application Settings to Standardize Flow Cytometry Results Across Experiments and Instruments

While many fluorescence-based flow flow cytometrycytometry assays can be run without concern for hitting the exact same fluorescence intensity target values across different experiments, there are assays that require standardization such that assays run on different days, or even different flow cytometers will render results that can be directly compared.  BD Biosciences has developed a protocol for enabling “Application Settings” on machines running the FACSDiva V6 software, to create settings that allow for standardized consistent fluorescence intensity target values to be obtained across experiments run on different days or instruments.

The ability to collect replicable fluorescence intensity values across assays is invaluable when assays require directly comparable results.  This can easily be envisioned for use in the clinical setting where specifically defined expression levels of a given marker may be used for prognostic or diagnostic indications or therapeutic responses.  Other examples include assays where the number of samples is too large for an experiment to be logically performed on a single day, or time series experiments where samples will be assayed for the same parameters and assessed for their changes over time.

Creating an optimized Application Settings for a given antibody staining panel requires several steps and the understanding of several principles of flow cytometry, and a thorough reading of the protocol referenced at the end of the article is recommended.  Here I will discuss the basics for generating Application Settings and using them on the same cytometer.  For a more detailed explanation of the procedure and how to apply this to additional instruments which have the exact same laser and detector configurations, please refer to BD’s protocol.

In the first step of this protocol, the user runs the standard Cytometer Setup and Tracking (CS&T) software using the CS&T beads.  This will determine the optimized photomultiplier (PMT) detector voltages for the CS&T beads to minimize electronic noise while maintaining the brightest fluorescence staining in the linear range of the detector.  However, these voltages are optimized for these beads and not for cells.  Thus, once the CS&T report is generated, the next step is to optimize the settings for the cells and stains of interest.

In the next step of this protocol, the objective is to adjust the voltage settings to optimize the balance between the electronic noise and the linear range for each detector using the same cells and fluorescent antibody stains for which the application settings are being created.  The negatively stained cell populations are desired to be located above the noise on the low end, and the positively stained cell populations need to be within the linear range of the measurement.

The electronic noise robust standard deviation (rSDEN) is determined by the CS&T software and indicated in the CS&T report for each detector.  To determine the optimal location between the noise and background for the negatively stained cell populations, a calculation of 2.5 x rSDEN is made for each detector.  Then the voltages are adjusted while running the negatively stained cells to place them at this median fluorescence intensity (MFI) value for every detector being used.

After adjusting for all of the negative populations, the positively stained cells must be assessed to ensure that the cells are still within the detector’s linear range.  The CS&T report also generates a linearity max channel value for each detector.  Thus, the MFI of the positively stained population should be below this value, and allow for any anticipated increases in expression to remain below this value.  Remaining within the linear range is more important than having the negative populations at the 2.5 x rSDEN levels.  Thus, when there is very bright staining, this is important to keep in mind and the voltage should be lowered accordingly.

Finally, after the user has adjusted the voltages to the optimal settings for each detector, the application settings can be saved using the FACSDiva V6 software under: Cytometer Settings -> Application Settings -> Save.

Once the application settings have been created, they can be applied in any future experiments.  To use them, following daily CS&T cytometer setup and performance checks, open a new experiment.  Apply the Use CS&T Settings selection.  Then open the application settings under: Cytometer Settings -> Application Settings -> Apply.  Now consistent MFIs should be obtained for cells run on different experimental days.  One final note is that additional considerations need to be taken if the baseline target values change over time, or a new lot of CS&T beads is used for the daily cytometer setup.  The BD protocol discusses what to do in these instances.

Protocol:

Standardizing Application Setup Across Multiple Flow Cytometers Using BD FACSDiva™ Version 6 Software.  Ellen Meinelt, Mervi Reunanen, Mark Edinger, Maria Jaimes, Alan Stall, Dennis Sasaki, Joe Trotter.

Upcoming Immunology Conferences: July – September, 2013

I previously posted on  Immunology Conferences: March- June, 2013 and 2013 Conferences in Tumor Immunology and Cancer Immunotherapy

This listing will include upcoming Immunology-related conferences from July – September, 2013.


July:

Frontiers in Immunology Researchdescribe the image

July 1 – 4, 2013.

Monte Carlo, Monaco


14th International TNF Conference

July 7 – 10, 2013.

Loews Le Concorde, Quebec, Canada.

Travel grant application deadline: April 5, 2013.

Early Registration deadline: April 5, 2013.


British Society of Allergy & Clinical Immunology Annual Meeting: Allergy Across the Ages

July 8 – 10, 2013.

The International Centre, Telford, UK.

Abstract submission deadline: April 8, 2013.

BSACI membership deadline: June 10, 2013.

Travel fellowship deadline: May 20, 2013.

Early Registration deadline: May 26, 2013.


FASEB Conference: Autoimmunity

July 7 – 12, 2013

Saxtons River, Vermont, USA.

Early Registration deadline: June 3, 2013.


AAI Introductory Course in Immunology

July 13 – 18, 2013.

University of Pennsylvania, Philadelphia, PA, USA.

An intensive introductory immunology course.

Registration deadline: June 28, 2013.


FASEB Conference: Molecular Mechanisms of Lymphocyte Development and Function

July 14 – 19, 2013.

Steamboat Springs, Colorado, USA.

Early Registration deadline: June 3, 2013.


16th International Congress of Mucosal Immunology (ICMI 2013)

July 17 – 20, 2013.

Westin Bayshore Vancouver, Vancouver, Canada.

Late Breaking Abstract Submission Deadline: April 15, 2013.


The American Society for Virology 32nd Annual Scientific Meeting

July 20 – 24, 2013.

Pennsylvania State University, State College, PA, USA.

Early Registration Deadline: May 31, 2013.

T Follicular Helper Cells: Basic Discoveries and Clinical Applications

July 21 – 26, 2013.

The Chinese University of Hong Kong, Hong Kong, China.

Short-talk abstracts deadline: May 15, 2013.

Application deadline: June 23, 2013.

AAI Advanced Course in Immunology
July 28 – August 2, 2013.

Seaport World Trade Center, Boston, MA, USA.

Registration deadline: July 12, 2013.


August:

FASEB Conference: Gastrointestinal Tract XV: Epithelia, Microbes, Inflammation and Cancer

August 11–15, 2013.

Steamboat Springs, Colorado, USA

Registration deadline: July 3, 2013.


14th European Meeting on Complement in Human Disease (EMCHD)

August 17-21, 2013.

Jena, Germany.

Early registration deadline: June 21, 2013.


15th International Congress of Immunology

August 22-27, 2013.

MiCo – Milano Congressi, Milan, Italy.

Late Abstract Deadline: June 30, 2013.

Early Registration Deadline: April 15, 2013.


Immune-related Pathologies: Understanding Leukocyte Signalling and Emerging therapies (IMPULSE 2013)

August 31– September 3, 2013.

Mátraháza, Hungary

Abstract Submission Deadline: June 15, 2013.

Early Registration Deadline: June 15, 2013.


September:

ESF-EMBO Symposium: B Cells From Bedside To Bench And Back Again

September 2–7, 2013.

Pultusk, Poland.

Application Deadline: June 3, 2013.


7th Leukocyte signal Transduction Conference

September 8 – 13, 2013.

Grecotel Kos Imperial Hotel, Kos, Greece.

Early Registration Deadline: June 15, 2013.

Abstract Submission Deadline: June 15, 2013.

Travel Award Application Deadline: June 30, 2013.

2nd International Conference on ImmunoMetabolism: Molecular and Cellular Immunology of Metabolism

September 15–20, 2013.

Sheraton Conference Center, Rhodes, Greece.

Abstract Submission Deadline: June 15, 2013.

Early Registration Deadline: June 15, 2013.

Travel Award Application Deadline: June 30, 2013.


Cytokines 2013: From Molecular Mechanisms to Human Disease

September 29 – October 3, 2013

Hyatt Regency San Francisco, San Francisco, CA, USA.

Early Registration Deadline: May 7, 2013.

Abstract Submission Deadline: May 7, 2013.

A free iPhone/iPad App for the meeting is now available!

The Android version will be out very soon.


3rd International Lymphoid Tissue Meeting

September 15–17, 2013.

Rotterdam, The Netherlands.

Abstract Submission Deadline: July 1, 2013.

Early Registration Deadline: July 15, 2013.


Websites that list upcoming Conferences & Events in Immunology, Tumor Immunology, and Cancer Immunotherapy:

The American Association of Immunologists (AAI) Meetings and Events Calendar

Nature Reviews Immunology’s list of conferences

Cancer Immunity Journal’s List of Conferences

FASEB Scientific Research Conferences Calendar 


When can B cells make IL-17?

IL-17 cytokines are best known for their roles in describe the imageimmune defense against bacterial and fungal infections and in the pathogenesis of inflammatory autoimmune diseases including rheumatoid arthritis(RA), multiple sclerosis(MS), and psoriasis.   Cells that are known to be producers of IL-17 include CD4+ TH17 T cells, CD8+ TC17 T cells, type 3 innate lymphoid cells (ILC3/lymphoid tissue-inducer cells), gd T cells, and NKT cells.  However, in a recent article in Nature Immunology, Bermejo et. al demonstrate that B cells are primary producers of IL-17 during infection with the protozoan parasite,Trypanosoma cruzi.  Furthermore, B cells activated IL-17 production through an entirely novel pathway.

IL-17 comprises a family of six related homo- or hetero-dimeric functioning cytokines (IL-17A – IL-17F) that signal through a complex family of multimeric IL-17 receptors (IL-17RA – IL-17RE).  IL-17 cytokines activate a unique signaling pathway through the adaptor protein Act1 which leads to induction of several transcription factors including NF-kB, IκBζ, C/EBPδ, C/EBPβ, MAPK, and PI3K.

In the study by Bermejo et. al, the authors sought to identify all of the cell types producing IL-17 during in vivo infection of mice with T. Cruzi.  Interestingly, the majority of splenic cells producing IL-17 at 10 and 19 days post-infection were CD3 and instead expressed CD19 and B220, markers of B cells.  Further characterization of these cells revealed expression of the plasmablast marker CD138, but not germinal center B cell markers.  IL-17+B220+ cells were absent in T. Cruzi infected B cell-deficient μMT mice and these mice were less able to control the infection and had higher levels of IFN-gamma and TNF.  Thus, B cells were not only the major IL-17 producers during T. Cruzi infection, but played a major role in protective immune responses and limiting immune pathology.

In mice, the generation of IL-17 producing TH17 cells is driven by IL-6, IL-23, and the transcription factors RORgammaT, ROR-alpha, and Ahr.  However, IL-17 producing B cells were still generated in T. Cruzi infected mice or B cells lacking IL-6, IL-23R, RORgammaT, Ahr, or treated with inhibitors of ROR-alpha.  In vitro exposure of purified B cells to T. Cruzi induced production of IL-17; however this was not mimicked by incubation of B cells with TLR2, TLR4, or TLR9 ligands, further indicating the lack of a role for inflammatory cytokines upregulated by TLRs in inducing IL-17 in B cells.  T cells did not produce IL-17 in response to T. Cruzi.  Thus the known regulators of IL-17 producing cells were not involved in the unique induction of IL-17 in B cells by T. Cruzi.

The authors focused on T. Cruzi trans-sialidase, a surface GPI-anchored enzyme, as being the potential IL-17 inducing signal, due to its previously described activity as a B cell mitogen.  Treatment of B cells with recombinant enzymatically active trans-sialidase recapitulated IL-17 production and a blocking antibody against the enzymatic site of trans-sialidase completely inhibited the induction of IL-17 during T. Cruzi exposure.  Through a series of experiments, the authors determined that trans-sialidase-mediated sialylation of the surface marker CD45 was required for B cell IL-17 production.  The signaling pathway downstream of CD45 leading to IL-17 induction was found to involve Src kinases, Btk, and Tec.

Finally, the authors examined if this phenomenon occurs in human B cells as well.  CD19+ B cells were isolated from tonsils and the production of IL-17 was also seen in response to T. Cruzi exposure in a CD45 and Btk dependant fashion.

In conclusion, this was an exciting study that demonstrated not only that B cells are major IL-17 producers during parasitic infections, but also identified a unique signaling pathway that mediates this effect in both mice and humans.  Many questions remain about how this unique signal transduction pathway operates only in plasmablast B cells but not other cell types, despite the widespread expression of CD45 by hematopoietic cells.  Furthermore, the role of IL-17 production by B cells in immune responses to other pathogens that express trans-sialidases as well as the role for these B cells in IL-17-driven immune pathologies remains to be explored.

Further Reading:

Trypanosoma cruzi trans-sialidase initiates a program independent of the transcription factors RORγt and Ahr that leads to IL-17 production by activated B cells.  Bermejo DA, Jackson SW, Gorosito-Serran M, Acosta-Rodriguez EV, Amezcua-Vesely MC, Sather BD, Singh AK, Khim S, Mucci J, Liggitt D, Campetella O, Oukka M, Gruppi A, Rawlings DJ. Nat Immunol. 2013 May;14(5):514-22. doi: 10.1038/ni.2569.

IL-17-producing B cells combat parasites.  León B, Lund FE. Nat Immunol. 2013 May;14(5):419-21. doi: 10.1038/ni.2593.

Recent advances in the IL-17 cytokine family.  Gaffen SL. Curr Opin Immunol. 2011 Oct;23(5):613-9. doi: 10.1016/j.coi.2011.07.006.

Development and evolution of RORγt+ cells in a microbe’s world.  Eberl G. Immunol Rev. 2012 Jan;245(1):177-88. doi: 10.1111/j.1600-065X.2011.01071.x.


The nuances of using CFSE to monitor lymphocyte proliferation

Measuring proliferation of lymphocytes such as T cells isolated from peripheral blood monuclear cells (PBMC) using carboxyfluorescein diacetate succinimidyl ester (CFSE) is not a foolproof protocol.  CFSE can be toxic to cells and non-optimal CFSE labeling conditions can thus hamper proliferation of cells and obscure interpretation of results.  An article in Nature Protocols by Quah et al., details CFSE labeling conditions and how to achieve optimal results.

CFSE is a fluorescent cell membrane permeable dye with similar excitation and emission properties as fluorescein isothiocyanate (FITC).  Thus CFSE can be assayed in flow cytometry by the same channels that detect the fluorescence intensity of FITC.  The CFSE precursor, carboxyfluorescein diacetate succinimidyl ester (CFDA-SE) that is used to label cells is non-fluorescent, but once inside cells, acetate groups are removed by intracellular esterases, causing the resulting CFSE molecule to become fluorescent and also less membrane permeable.  Furthermore, the succinimidyl ester group of CFSE covalently couples to primary amine groups, thus remaining bound to proteins inside cells for long time periods.  As a cell divides, the intensity of CFSE staining in the resultant daughter cells will be half that of the parent, allowing easy flow cytometric assessment of the number of cell divisions that have occurred since labeling.

While CFSE is commonly used to assess lymphocyte proliferation, CFSE can be toxic and impair cell division.  According to Quah et al., four parameters of the labeling conditions must be considered to minimize this toxicity:

1. The concentration of the cells.

2. The concentration of CFSE.

3. The duration of cell labeling.

4. The presence of amino acids in the labeling media.

CFSE will bind to free amines in aqueous conditions and thus reduce the remaining CFSE concentration. To avoid the loss of CFSE to amino acids in the labeling media, PBS is the recommended diluent for CFSE prior to adding to cells.  Cells are uniformly suspended in PBS with serum, and the CFSE/PBS stock is immediately mixed rapidly with the cells and allowed to incubate for the optimal amount of time.

Regarding cell and CFSE concentration, these two parameters must be considered in the context of the other.  Cells at higher concentrations can be labeled with higher concentrations of CFSE with a minimal effect of CFSE toxicity on cell division.  For instance, cells at a concentration of 50 x 106/ml can be labeled with 5uM CFSE, but cells at a concentration of 1 x 10⁶/ml will experience significant toxicity if labeled with 5uM CFSE but will do well with 1uM CFSE.  The time of labeling is also important, and longer incubation times will increase toxicity.  Quah et al. recommended 5 minutes of incubation with CFSE before washing the cells.

To assess proliferation, after CFSE labeling, cells are washed and then stimulated with a mitogenic signal.  For instance, T cells can be stimulated with anti-CD3 + anti-CD28, PHA, SEB, PMA + ionomycin or other stimuli.  Then the cells will be allowed to divide for a number of days which must also be optimized depending on the stimulus used.

T cells will die if left unstimulated in vitro and as they proliferate, they can undergo activation induced cell death (AICD).  Thus, some amount of cell loss must be anticipated.  In an accompanying protocol in Nature Methods, Hawkins et al. detail the incorporation of cell count beads during flow cytometry to more accurately measure the degree of cell proliferation.

Thus, there are many nuances to consider when using CFSE to label cells for assays such as proliferation.  I recommend reading both of these protocols to achieve robust assay performance.

Further Reading:

Monitoring lymphocyte proliferation in vitro and in vivo with the intracellular fluorescent dye carboxyfluorescein diacetate succinimidyl ester.  Quah BJ, Warren HS, Parish CR. Nat Protoc. 2007;2(9):2049-56.

Measuring lymphocyte proliferation, survival and differentiation using CFSE time-series data.  Hawkins ED, Hommel M, Turner ML, Battye FL, Markham JF, Hodgkin PD. Nat Protoc. 2007;2(9):2057-67.


Tissue Resident CD8+ Memory T cells: A front line defense?

Memory CD8+ T cells continually Tcell cytolysis
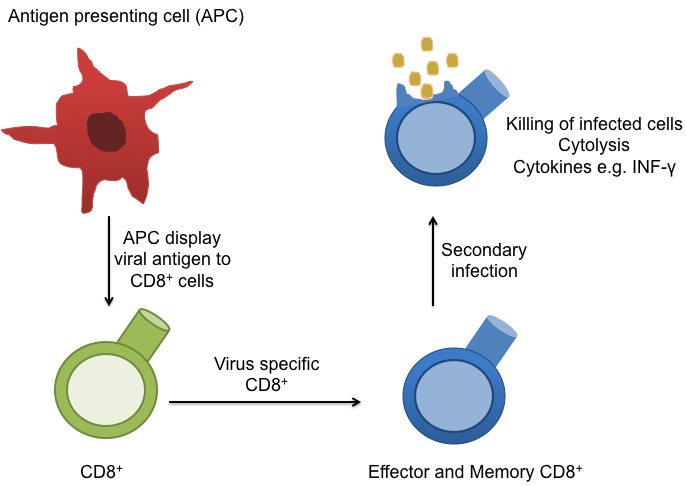
circulate in the blood, lymph, and secondary lymphatic organs as they patrol for the presence of secondary infections.  Recently, a class of effector memory CD8+ T cells has also been shown to migrate to and reside long-term in non-lymphoid tissues. These tissue resident memory T cells can quickly respond to tissue infections with their cognate pathogen.  CD8+ T cells mainly function in killing of infected cells though cytolysis and by producing effector cytokines, including IFN-gamma to activate other immune cells.  In a recent article in Nature Immunology, Schenkel et. al demonstrate an additional function for these tissue resident memory CD8+ T cells: as major producers of chemokines that recruit circulating memory T cell forces to the site of infection.

In this study, Lymphocytic choriomeningitis virus (LCMV) was injected intraperitoneally into female mice that had been adoptively transferred with naïve TCR transgenic CD8+ T cells specific for the gp33 epitope expressed by LCMV.  Two months later, mice were transcervically infected with a Vaccinia virus strain engineered to express gp33 (VV-gp33) and the kinetics of the CD8 T cell recall response in the mucosal tissues of the female reproductive tract were assessed.  Gp33-specific tissue resident memory CD8+ T cells were required for the rapid (within 2 days) recruitment of additional circulating gp33-specific T cells into the tissues.  However, if the secondary infection was with a Vaccinia virus strain expressing a different antigen (OVA), then relatively few memory T cells were seen accumulating in the reproductive tract tissue.  This specificity was also seen when gp33 versus OVA peptides were transcervically injected into the tissues instead of infection with VV.

To derive the mechanisms underlying the recruitment of T cells to infected tissue sites, chemokine expression was assessed.  CXCL9 as well as multiple other chemokines were found to be rapidly induced in various cells residing in the reproductive tissues including endothelial cells, tissue dendritic cells, and memory CD8+ T cells.  Production of IFN-gamma by the tissue resident memory CD8+ T cells was required for both recruitment of additional memory CD8+ T cells to the site as well as CXCL9 production by endothelial cells.

Antigen presenting cells as well as activated T cells produce copious amounts of IFN-gamma and it is expected that IFN-gamma production would elicit CXCL9 expression as the alternate name of CXCL9 is monokine induced by IFN-gamma (MIG).  In this study however, it was production of IFN-gamma by the antigen-specific (gp33) tissue resident memory CD8+ T cells that was critical in the expression of chemokines such as CXCL9 and further recruitment of additional memory CD8+ T cells into the infected tissues.  Antigen presenting cells alone were not as productive in this process because when the secondary infection was instead performed with an OVA-antigen expressing vaccinia virus, significant numbers of OVA-specific T cells were not recruited to the infected tissues.

Thus, this study demonstrated that antigen-specific CD8+ memory T cells that reside in tissues function to significantly amplify innate immune alarms to secondary infections by recruiting additional circulating CD8+ memory T cells to the infected site.

Further Reading:

Sensing and alarm function of resident memory CD8(+) T cells.  Schenkel JM, Fraser KA, Vezys V, Masopust D. Nat Immunol. 2013 May;14(5):509-13. doi: 10.1038/ni.2568. Epub 2013 Mar 31.

Hidden memories: frontline memory T cells and early pathogen interception.  Masopust D, Picker LJ. J Immunol. 2012 Jun 15;188(12):5811-7. doi: 10.4049/jimmunol.1102695.

Chemokine monokine induced by IFN-gamma/CXC chemokine ligand 9 stimulates T lymphocyte proliferation and effector cytokine production.  Whiting D, Hsieh G, Yun JJ, Banerji A, Yao W, Fishbein MC, Belperio J, Strieter RM, Bonavida B, Ardehali A. J Immunol. 2004 Jun 15;172(12):7417-24.

Identification of Type I Innate Lymphoid Cells that functionally resemble TH1 and NK cells

Innate lymphoid cells (ILCs) are subsets of lymphoid cells that do not rearrange their antigen receptors like T cells and B cells but have other features of lymphocytes.  ILCs include the Natural Killer (NK) cell subset, as well as cells that behave similarly to T helper cell subsets by producing similar characteristic cytokines.  Type 2 ILCs (ILC2) resemble TH2 describe the imagecells in that they produce IL-5 and IL-13.  RORγt+ ILCs aka ILC3s, include subsets that resemble TH17 and TH22 cells by producing IL-17 and IL-22, respectively, as well as a subset that produces both cytokines.   Several recent articles have identified another class of ILCs in both humans and mice.  These cells resemble TH1 cells in that they express T-bet/TBX21 and produce IFN-gamma, and are distinct from conventional NK cells found among peripheral blood mononuclear cells (PBMC).  These newly characterized cellular subsets have been denoted as Type 1 ILCs (ILC1).

In the April 2013 issue of Immunity, Fuchs et. al sought to more fully characterize the ILC subsets present in human mucosal lymphoid tissues.  In human tonsils, a CD3CD56+ NKp44+CD103+ subset was identified that expressed T-bet and produced IFN-gamma when stimulated with either PMA/ionomycin, IL-12, or IL-15.  These cells also expressed perforin and granzyme and had cytolytic activity.  Although these cells express CD56+and NKp44+, which are markers characteristic of NK cells, they appear to be related to but distinct from prototypical CD56hi NK cells found in PBMC.  For instance, unlike CD56hi PBMC NK cells, these ILC1 did not exhibit a response to IL-18, as measured by a synergistic production of IFN-gamma when stimulated with IL-12+ IL-18 vs. IL-12 alone.

In a separate study, published in the March 2013 issue of Nature Immunology, Bernink et. al identified a mucosal human ILC1 subset in tonsils that differs from that found by Fuchs et. al, being CD56NKp44as well asCD127+ and c-Kit.  Similarly to the cells described by Fuchs et. al, these cells expressed T-bet and produced  IFN-gamma when stimulated with PMA/ionomycin or IL-12.  However, they did not express perforin and granzyme.  Additional characterizations differentiated these cells from NK cells including the lack of the KIR3DL1 and IL-15Rα markers expressed by NK cells.

ILCs have been found to reside in mucosal associated lymphoid tissues include the oral, lung, and gastrointestinal mucosa, and are thought to function in immune responses to pathogens as well as in tissue repair.  ILCs including ILC3s have also been found to participate in inflammatory disease pathogenesis.  Both types of ILC1 cells were shown to be increased in the intestinal mucosa of Crohn’s disease patients, although their exact locations differed.  CD56+ NKp44+CD103+ cells were found to accumulate in the intraepithelial layer while CD127+CD56c-KitNKp44cells were found in the lamina propria.  Thus, these two subsets of ILC1 cells differ in multiple aspects including tissue localization.

In conclusion, both types of ILC1 cells identified in these studies are distinct from conventional PBMC CD56hi NK cells, express T-bet, and produce IFN-gamma in response to IL-12 and IL-15 stimulation.  Notably, ILC3 cells also heterogeneously express CD56, IFN-gamma, granzymes and perforin.  Thus, many questions remain as to the functional and developmental differences between different ILC subsets and between CD56+ ILC1 cells and PBMC NK cells that reside in various tissues.

Reading:

Intraepithelial Type 1 Innate Lymphoid Cells Are a Unique Subset of IL-12- and IL-15-Responsive IFN-γ-Producing Cells.  Fuchs A, Vermi W, Lee JS, Lonardi S, Gilfillan S, Newberry RD, Cella M, Colonna M. Immunity. 2013 Apr 18;38(4):769-81.

Human type 1 innate lymphoid cells accumulate in inflamed mucosal tissues.  Bernink JH, Peters CP, Munneke M, te Velde AA, Meijer SL, Weijer K, Hreggvidsdottir HS, Heinsbroek SE, Legrand N, Buskens CJ, Bemelman WA, Mjösberg JM, Spits H.  Nat Immunol. 2013 Mar;14(3):221-9.

ILC1 Populations Join the Border Patrol.  Maloy KJ, Uhlig HH. Immunity. 2013 Apr 18;38(4):630-2. doi: 10.1016/j.immuni.2013.03.005.

Innate lymphoid cells: emerging insights in development, lineage relationships, and function.  Spits H, Cupedo T. Annu Rev Immunol. 2012;30:647-75.

A T-bet gradient controls the fate and function of CCR6-RORγt+ innate lymphoid cells.  Klose CS, Kiss EA, Schwierzeck V, Ebert K, Hoyler T, d’Hargues Y, Göppert N, Croxford AL, Waisman A, Tanriver Y, Diefenbach A.  Nature. 2013 Feb 14;494(7436):261-5.

Going Serum-Free in Cryopreserving PBMCs: Better Immunoassay Performance?

Probably the most common way to cryopreserve cells, including human peripheral blood mononuclear cells (PBMC) is using a mixture of 90% serum with 10% DMSO.  However, serum is very expensive, and every new lot must first be tested for its effects on the background and performance of the various cellular assays performed.  A recent article in Cancer, Immunology, Immunotherapy, by Filbert et. al, reports on the results of an effort led by the Cancer Immunotherapy Immunoguiding Program to compare the viability, recovery, and performance in IFN-gamma ELISPOT assays of PBMCs cryopreserved in serum-containing versus various serum-free mediums.

This was a large-scale study which engaged 31 labs across ten countries.  This study is part of a larger concerted effort by the Immunoguiding Program of the Cancer Immunotherapy Association and the Cancer Research Institute’s Cancer Immunotherapy Consortium to assess the importance of harmonizing the most commonly utilized immunological assays across institutions, such that standardized results can be obtained.  The major inertia driving this effort is to establish a platform for standardized evaluation of patient immune responses to support the growing field of clinical immunotherapeutics.

In this study, three different freezing media were compared in 31 labs and seven freezing media were compared in a single center.  Human PBMCs from HLA-A*0201 donors were cryopreserved in these various freezing mediums and sent to the different labs for evaluation of viability, recovery, and performance in IFN-gamma ELISPOT protocols against several HLA-A*0201-restricted epitopes from HCMV, Influenza, and EBV viruses.  Each lab used its own established ELISPOT protocol.

All 31 labs compared PBMCs cryopreserved in (1) 90 % heat-inactivated human AB serum + 10 % DMSO, (2) CryoMaxx II, and (3) 10 % human serum albumin (HSA) + 10 % DMSO + 80 % RPMI.  Interestingly, the viability of cells after thawing as well as the number of cells recovered after thawing and after a 1-24 hour rest, were found to be significantly higher in both serum-free mediums compared to the human AB serum-containing media.  The overall cell loss from the number of cells initially cryopreserved ended up being an average of 35.2 % for PBMCs cryopreserved in the human AB serum-containing media, and roughly 22% for both of the serum-free mediums.  Thus, these assays suggest that these serum-free mediums provide more optimal freezing conditions compared with the human AB serum-containing media.  The performance in ELISPOT assays however, was not found to be significantly different for cells frozen in these different mediums.

In addition to those three mediums, a single laboratory made the same assessments for PBMCs cryopreserved in an additional four mediums: (4) CryoKit ABC, (5) 90 % heat-inactivated FCS + 10 % DMSO, (6) 12.5 % BSA + 77.5 % RPMI + 10 % DMSO, and (7) 12.5 % BSA + 77.5 % RPMI + 5 % DMSO + 5 % hydroxyethyl starch. In this comparison however, serum-free and serum-containing mediums had similar effects on viability, cell recovery, and in the ELISPOT assay, although the BSA-containing mediums had the worst performance overall.

In conclusion, although commonly used FBS and FCS-containing mediums were not compared in the multi-lab test, the strong performance of cells cryopreserved in serum-free media regarding subsequent viability, recovery, and in ELISPOT assays recommends that further consideration be given to cryopreservation in such serum-free media. Long term storage quality of cells frozen in various serum-free media is still an issue to be addressed as well as the comparative performance of PBMCs in the many other immunological assays.  Using defined serum-free media as opposed to lot-variant serum-containing media may allow for more robust standardization of immunological assays.

Serum-free freezing media support high cell quality and excellent ELISPOT assay performance across a wide variety of different assay protocols.  Filbert H, Attig S, Bidmon N, Renard BY, Janetzki S, Sahin U, Welters MJ, Ottensmeier C, van der Burg SH, Gouttefangeas C, Britten CM. Cancer Immunol Immunother. 2013 Apr;62(4):615-27. doi: 10.1007/s00262-012-1359-5. Epub 2012 Nov 9.

The impact of harmonization on ELISPOT assay performance.  Janetzki S, Britten CM. Methods Mol Biol. 2012;792:25-36. doi: 10.1007/978-1-61779-325-7_2.

Harmonization of immune biomarker assays for clinical studies.  van der Burg SH, Kalos M, Gouttefangeas C, Janetzki S, Ottensmeier C, Welters MJ, Romero P, Britten CM, Hoos A. Sci Transl Med. 2011 Nov 9;3(108):108ps44. doi: 10.1126/scitranslmed.3002785.

Standardized Serum-Free Cryomedia Maintain Peripheral Blood Mononuclear Cell Viability, Recovery, and Antigen-Specific T-Cell Response Compared to Fetal Calf Serum-Based Medium.  Germann A, Schulz JC, Kemp-Kamke B, Zimmermann H, von Briesen H. Biopreserv Biobank. 2011 Sep;9(3):229-236.

Identification of a Novel Eomesodermin Expressing T cell Subset

41BB (CD137) is a costimulatory receptor transiently upregulated on T cells following activation.  41BB is activated by its ligand 41BBL (TNFSF9), a TNF receptor superfamily member expressed by activated antigen presenting cells and anti-41BB agonistic antibodies are in clinical trials for cancer immunotherapy.  In a recent article in The Journal of Experimental Medicine, Curran et. al demonstrate that 41BB activation of T cells leads to the generation of a novel subset of CD4+ and CD8+ T cells dependant on the master transcription factor Eomesodermin (Eomes).

describe the imageActivation of 41BB on T cells leads to enhanced T cell survival.  Anti-41BB-agonistic antibodies have demonstrated significant anti-tumor activity in mice by enhancing anti-tumor cytotoxic T cell responses.  Thus, there are currently several clinical trials underway exploring the efficacy of anti-41BB-agonist antibodies in several types of cancers, including melanoma, renal carcinoma, ovarian cancer, and lymphoma.  In a previous study by the same group (Curran et. al, PLoS One, 2011), an observation was made that a unique subset of T cells infiltrated B16 melanoma tumors in mice after anti-41BB-agonistic antibody treatment.  These T cells expressed the inhibitory receptor KLRG1, and elicited strong anti-tumor activity.  Thus, in the current study, the authors sought to further characterize this T cell subset in mice.

To define the phenotype and functions of tumor-associated KLRG1+ versus KLRG1T cells types, T cells were isolated from B16 tumors established in mice, following treatment with anti-41BB antibodies plus irradiated Flt3-ligand–expressing B16 cells (FVAX) or FVAX alone. The addition of FVAX further enhanced the tumor-infiltrating frequency of KLRG1+ T cells elicited by anti-41BB antibodies.  Gene expression analysis revealed that KLRG1+ CD4+ and CD8+ T cells expressed significantly higher levels of cytoxicity genes: multiple granzymes, perforin, and FasL, than KLRG1T cells.  In vitro cytotoxicity assays with B16 melanoma cell targets demonstrated enhanced killing capacity of KLRG1+ compared with KLRG1 CD4+ and CD8+ T cells.

Superior cytotoxic functions are generally associated with CD4+ TH1 and CD8+ TC1 T cell subsets, dependant on the transcription factor T-bet (TBX21).  However, analysis of expression of the known master transcription factors governing different T cell subsets, found that expression of Eomes but not T-bet was elevated in KLRG1+ T cells.  Runx3 expression was also slightly elevated in KLRG1+ versus KLRG1T cells.  Furthermore, transgenic mice lacking Eomes expression in CD4+ cells (CD4-CRE/Eomesflox/flox) did not develop tumor-infiltrating KLRG1+ T cells after anti-41BB antibody treatment, demonstrating the necessity of Eomes for development of these cells, even when Eomes expression is only absent in the CD4+ T cell compartment.  Thus, these novel subsets of KLRG1+ T cells were termed CD4+ THEO and CD8+ TCEO T cells.

Interestingly, KLRG1+ T cells play a role not only in anti-tumor immunity, but were induced and found at significant levels in spleens and livers from mice infected with Listeria Monocytogenes or LCMV.

As this is a newly described T cell subset, many questions remain.  However, most relevant is whether equivalents of these cells exist in humans, and the roles they play in human diseases.

Further Reading:

Systemic 4-1BB activation induces a novel T cell phenotype driven by high expression of Eomesodermin.  Curran MA, Geiger TL, Montalvo W, Kim M, Reiner SL, Al-Shamkhani A, Sun JC, Allison JP. J Exp Med. 2013 Apr 8;210(4):743-55.

Combination CTLA-4 blockade and 4-1BB activation enhances tumor rejection by increasing T-cell infiltration, proliferation, and cytokine production.  Curran MA, Kim M, Montalvo W, Al-Shamkhani A, Allison JP. PLoS One. 2011 Apr 29;6(4):e19499.

Immunotherapy of cancer with 4-1BB.  Vinay DS, Kwon BS. Mol Cancer Ther. 2012 May;11(5):1062-70. doi: 10.1158/1535-7163.MCT-11-0677. Epub 2012 Apr 24.

Immune regulation by 4-1BB and 4-1BBL: complexities and challenges.  Wang C, Lin GH, McPherson AJ, Watts TH. Immunol Rev. 2009 May;229(1):192-215.

Antigen Cross-Presentation by Human Dendritic Cell Subsets

Dendritic cells (DC) are major antigen-presenting cells consisting of numerous heterogeneous subtypes.   In humans, several subtypes of DCs have been identified in different tissues including peripheral blood, secondary lymphoid organs, and in the skin.  In peripheral blood mononuclear cells (PBMC) and secondary lymphoid organs, these subtypes include BDCA1+, BDCA3+, and plasmacytoid DCs which differ functionally and in expression of various markers. So how do these many human DC subsets differ functionally?

Antigen crossdescribe the image-
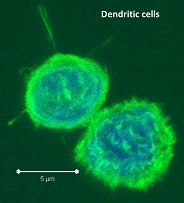
presentation is a DC-specialized mechanism by which antigens are taken up through endocytic and phagocytic pathways but presented in the context of MHC-class I, to activate antigen-specific cytotoxic CD8 T cells.  Recent studies have sought to characterize the differences between the many tissue-associated DC subsets including their ability to cross-present antigen.

In PBMC, DCs are quite rare, comprising only 1 – 2% of PBMCs.  In previous blog posts, the generation of dendritic cells from PBMC monocytes and maturing and assaying monocyte-derived dendritic cells have been discussed.  However, blood DCs and in vitro generated DCs may not represent the true physiological state of DCs present in secondary lymphoid organs where natural antigen cross-presentation and T cell activation occur in vivo.

In a recent study in The Journal of Experimental Medicine, Segura et. al explored the antigen cross-presentation versus phagocytic capabilities of human BDCA1+, BDCA3+, and plasmacytoid DC subsets compared with CD11c+HLADR+CD14+ macrophages that were all freshly isolated from healthy donor tonsils.  The cross-presentation capabilities of different types of antigens, including necrotic dead cell antigens and soluble antigens were assessed.

For necrotic dead cell antigens, such as dead tumor cells, BDCA1+ and BDCA3+ DC subsets both took up antigens to a similar extent and were the most efficient in activating CD8+ T cell responses which were measured by IFN-gamma production in allogeneic mixed leukocyte reaction assays.  Macrophages far exceeded the ability of any DC subsets in dead cell phagocytosis, but were extremely poor at cross-presentation and CD8+ T cell activation.  Plasmacytoid DCs were the poorest at phagocytosis of dead cells, and were also unable to cross-present these antigens.  For soluble antigens however, all three DC subsets (BDCA1+, BDCA3+, and plasmacytoid DC) efficiently cross-presented both shorter and longer soluble peptides, while macrophages continued to be poor at cross-presentation.

In an additional set of assays, the authors explored mechanisms that may contribute to the differential phagocytosis versus antigen cross-presentation of DC subsets and macrophages.    Compared with macrophages which did not cross-present antigens, the endocytic compartments of cross-presenting DCs kept an alkaline pH and contained reactive oxygen species, and these DCs further were able to export internalized antigens to the cytosol where they can be loaded onto MHC-class I.  Thus, while macrophages are efficient phagocytes, they are unable to process antigens to allow for cross-presentation.

In conclusion, understanding the capabilities of immune cells in different tissues is critical to discovering the full spectrum of cellular functions.  DCs are a major target for vaccinations and immunotherapeutic strategies, and describing and understanding these subsets in vivo will lead to maximized success in immune modulating modalities.

Further Reading:

Similar antigen cross-presentation capacity and phagocytic functions in all freshly isolated human lymphoid organ-resident dendritic cells.  Segura E, Durand M, Amigorena S. J Exp Med. 2013 Apr 8.

Cross-presentation by dendritic cells.  Joffre OP, Segura E, Savina A, Amigorena S.  Nat Rev Immunol. 2012 Jul 13;12(8):557-69. doi: 10.1038/nri3254. Review.

BDCA-2, BDCA-3, and BDCA-4: three markers for distinct subsets of dendritic cells in human peripheral blood. Dzionek, A., A. Fuchs, P. Schmidt, S. Cremer, M. Zysk, S. Miltenyi, D.W. Buck, and J. Schmitz. 2000. J. Immunol. 165:6037–6046.

Characterization of resident and migratory dendritic cells in human lymph nodes.  Segura, E., J. Valladeau-Guilemond, M.H. Donnadieu, X. Sastre-Garau, V. Soumelis, and S. Amigorena. 2012. J. Exp. Med. 209:653– 660.

Gene family clustering identifies functionally associated subsets of human in vivo blood and tonsillar dendritic cells. Lindstedt, M., K. Lundberg, and C.A. Borrebaeck. 2005. J. Immunol. 175:4839–4846.

Functional specializations of human epidermal Langerhans cells and CD14+ dermal dendritic cellsKlechevsky, E., R. Morita, M. Liu, Y. Cao, S. Coquery, L. Thompson- Snipes, F. Briere, D. Chaussabel, G. Zurawski, A.K. Palucka, et al. 2008. Immunity. 29:497–510.

Characterization of dermal dendritic cells obtained from normal human skin reveals phenotypic and functionally distinctive subsets. Nestle, F.O., X.G. Zheng, C.B. Thompson, L.A. Turka, and B.J. Nickoloff. 1993. J. Immunol. 151:6535–6545.