Whole Blood Phospho-flow: Direct Ex Vivo Measurement of Signaling in PBMC

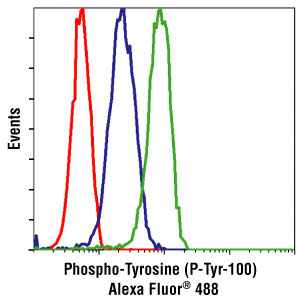
I previously discussed phospho-flow cytometry, a method to study intracellular protein phosphorylation events in peripheral blood mononuclear cells (PBMC) at the single cell level.  In standard phospho-flow cytometry protocols, prior to performing assays, PBMCs are first isolated from blood using density gradient centrifugation methods such as Ficoll.  However, there may be times when it is advantageous to study signaling pathways in relatively unmanipulated cells directly ex vivo.  For this, Chow et al. have established a protocol for performing phospho-flow cytometry on PBMCs directly in whole blood.

phospho_flow_cytometry

There are many advantages to isolating and cryopreserving PBMCs with the intention of later studying signaling events by methods including standard phospho-flow cytometry.  In particular, when comparisons are desired between patient groups and healthy controls, there is likely to be less confounding contributions of experimental variability to the results if all of the comparative samples are assayed together.  However, as discussed by Chow et al., pharmacodynamic monitoring as well as evaluation of constitutively activated signaling pathways in PBMCs would be best studied on cells having undergone the least manipulation.  Some signaling pathway responses may be more robust in whole blood PBMCs as well.  For example, I have found in my own assays that signaling responses to IL-6 are strongest in whole blood PBMCs compared with PBMCs following Ficoll or culture in the incubator for any amount of time.  This method can also be used to study bone marrow immune cell signaling as well as expression of intracellular molecules that are exposed by the permeabilization method chosen. In addition, looking at signaling events in murine PBMCs is difficult to do if PBMCs need to be isolated first, given the very small amount of blood that can be obtained from a mouse.  In these cases, anti-coagulated whole blood phospho-flow cytometry should be considered.

Whole blood phospho-flow cytometry is a relatively easy method.  Using 100 ul of whole blood is enough for this assay, and the stimulus (cytokine or other activating signaling molecule) is added directly to the whole blood for the preferred amount of time.  PBMCs are then fixed with formaldehyde and a Triton X-100 based buffer is added to lyse the red blood cells and permeabilize the white blood cells.  This is followed with a few washes and finally the cells can be treated with methanol to unmask phospho-epitopes, similarly to the standard phospho-flow cytometry method by Nolan and colleagues.  Chow et al. include an optional step in which the PBMCs can be stored in a freezing buffer prior to methanol treatment.  However, I have successfully stored PBMCs in 90-100% methanol at -20 or -80 ºC until staining for flow cytometry, similarly to what is done for the standard phospho-flow cytometry method by Nolan and colleagues.

As with all protocols involving treatment of cells with reagents such as methanol or Triton X-100, some epitopes may be lost and thus will not be evaluable if staining is done following these treatments.  Thus, there is an alternate method included in the protocol to stain for some antigens up front.  As a reminder however, some fluorophores are sensitive to methanol, for instance V500, and thus cannot be used to stain PBMCs prior to such treatments.  Finally, in a prior article, Chow et al. (2005), tested different methods of fixation, permeabilization and alcohol unmasking, and I have included the link to that article below as an excellent reference in the case that modulation of the protocol is required for optimal assessment of your antigens of interest.

Further Reading:

Whole blood processing for measurement of signaling proteins by flow cytometry.  Chow S, Hedley D, Shankey TV. Curr Protoc Cytom. 2008 Oct;Chapter 9:Unit 9.27.

Whole blood fixation and permeabilization protocol with red blood cell lysis for flow cytometry of intracellular phosphorylated epitopes in leukocyte subpopulations.  Chow S, Hedley D, Grom P, Magari R, Jacobberger JW, Shankey TV. Cytometry A. 2005 Sep;67(1):4-17.

Single-cell phospho-protein analysis by flow cytometry. Schulz KR, Danna EA, Krutzik PO, Nolan GP.Curr Protoc Immunol. 2012 Feb;Chapter 8:Unit 8.17.1-20.


Using Application Settings to Standardize Flow Cytometry Results Across Experiments and Instruments

While many fluorescence-based flow flow cytometrycytometry assays can be run without concern for hitting the exact same fluorescence intensity target values across different experiments, there are assays that require standardization such that assays run on different days, or even different flow cytometers will render results that can be directly compared.  BD Biosciences has developed a protocol for enabling “Application Settings” on machines running the FACSDiva V6 software, to create settings that allow for standardized consistent fluorescence intensity target values to be obtained across experiments run on different days or instruments.

The ability to collect replicable fluorescence intensity values across assays is invaluable when assays require directly comparable results.  This can easily be envisioned for use in the clinical setting where specifically defined expression levels of a given marker may be used for prognostic or diagnostic indications or therapeutic responses.  Other examples include assays where the number of samples is too large for an experiment to be logically performed on a single day, or time series experiments where samples will be assayed for the same parameters and assessed for their changes over time.

Creating an optimized Application Settings for a given antibody staining panel requires several steps and the understanding of several principles of flow cytometry, and a thorough reading of the protocol referenced at the end of the article is recommended.  Here I will discuss the basics for generating Application Settings and using them on the same cytometer.  For a more detailed explanation of the procedure and how to apply this to additional instruments which have the exact same laser and detector configurations, please refer to BD’s protocol.

In the first step of this protocol, the user runs the standard Cytometer Setup and Tracking (CS&T) software using the CS&T beads.  This will determine the optimized photomultiplier (PMT) detector voltages for the CS&T beads to minimize electronic noise while maintaining the brightest fluorescence staining in the linear range of the detector.  However, these voltages are optimized for these beads and not for cells.  Thus, once the CS&T report is generated, the next step is to optimize the settings for the cells and stains of interest.

In the next step of this protocol, the objective is to adjust the voltage settings to optimize the balance between the electronic noise and the linear range for each detector using the same cells and fluorescent antibody stains for which the application settings are being created.  The negatively stained cell populations are desired to be located above the noise on the low end, and the positively stained cell populations need to be within the linear range of the measurement.

The electronic noise robust standard deviation (rSDEN) is determined by the CS&T software and indicated in the CS&T report for each detector.  To determine the optimal location between the noise and background for the negatively stained cell populations, a calculation of 2.5 x rSDEN is made for each detector.  Then the voltages are adjusted while running the negatively stained cells to place them at this median fluorescence intensity (MFI) value for every detector being used.

After adjusting for all of the negative populations, the positively stained cells must be assessed to ensure that the cells are still within the detector’s linear range.  The CS&T report also generates a linearity max channel value for each detector.  Thus, the MFI of the positively stained population should be below this value, and allow for any anticipated increases in expression to remain below this value.  Remaining within the linear range is more important than having the negative populations at the 2.5 x rSDEN levels.  Thus, when there is very bright staining, this is important to keep in mind and the voltage should be lowered accordingly.

Finally, after the user has adjusted the voltages to the optimal settings for each detector, the application settings can be saved using the FACSDiva V6 software under: Cytometer Settings -> Application Settings -> Save.

Once the application settings have been created, they can be applied in any future experiments.  To use them, following daily CS&T cytometer setup and performance checks, open a new experiment.  Apply the Use CS&T Settings selection.  Then open the application settings under: Cytometer Settings -> Application Settings -> Apply.  Now consistent MFIs should be obtained for cells run on different experimental days.  One final note is that additional considerations need to be taken if the baseline target values change over time, or a new lot of CS&T beads is used for the daily cytometer setup.  The BD protocol discusses what to do in these instances.

Protocol:

Standardizing Application Setup Across Multiple Flow Cytometers Using BD FACSDiva™ Version 6 Software.  Ellen Meinelt, Mervi Reunanen, Mark Edinger, Maria Jaimes, Alan Stall, Dennis Sasaki, Joe Trotter.

Artifacts and non-specific staining in flow cytometry, Part II

flow cytometryIn Part I, I talked about un-specific binding and Fc-receptor binding. Besides these cases of non-specific binding, there are also other cases of antibody/fluorochrome binding that appears non-specific but that actually represents a real specific interaction – even though it is usually one that is not welcomed. I call these ‘pseudo-artifacts’ and you will read about some really odd stuff here.


(1) Binding of fluorochromes to Fc-receptors

The fact that Fc-receptors (FcR) bind antibodies is obvious, but lesser known is the fact that some of the fluorochrome linked to your antibody can also bind some FcRs.

It has been reported that R-phycoerythrin (PE) can bind to mouse Fc-gamma-RII  (CD16) and Fc-gamma-RIII (CD32) (Takizawa et al.). Furthermore, FcR binding of fluorochromes apparently applies to most or maybe even all cyanine fluorochromes, either alone or in tandem conjugates (Shapiro). So far I found reports for Cy5 (Jahrsdorfer et al.), PE-Cy5 (van Vugt et al.; Steward and Steward; Jahrsdorfer et al.) and APC-Cy7 (Beavis et al.). In this case, human CD64 (Fc-gamma-RI) was suggested to be the culprit of some of the binding (van Vugt et al.; Jahrsdorfer et al.), but binding also to CD64neg leukemia cells has been reported (Steward and Steward), so the role of FcR is not solved for all cases yet.

Þ Potential solution:

(a)  PE: For the binding of PE to mouse CD16/32 the use of a ‘Fc-block’, i.e. adding blocking monoclonal antibody 2.4G2 (rat IgG2b kappa), will avoid the problem (Takizawa et al.).

(b)  Cyanine: If you work with FcR+ cells, especially monocytes, you might consider avoiding cyanine-containing fluorochromes for the staining of your cells of interest.


(2) Binding of fluorochromes to antigen-receptors

Phycoerythrin (PE) and allophycocyanin (APC) are large proteins of 240kD and 110kD respectively that were original derived from cyanobacteria or red algae. As it turns out these phycobiliproteins are also a specific antigen for some T and B cells. Approximately 0.1% of all mouse B cells recognize PE as antigen in a BCR-dependent manner (Pape et al.; Wu et al.). Similar, about 0.02% of all mouse B cells are APC antigen-specific (Pape et al.). Furthermore, about 0.02-0.4% of all gamma-delta-T cells (mouse and human) recognized PE as a specific antigen (Zeng et al.) as well.

Þ Potential solution: Given their low frequency, these cells only pose a problem if you study tiny subsets of B and gamma-delta-T cells. In that case, you should avoid the use of PE for your cells of interest.

(3) Binding of fluorochromes to other receptors or interaction partners

(a) Cross-reactivity of the antibody:  Epitopes might be shared between different proteins, i.e. your antibody might not only recognize your protein in question, but recognizes also a similar epitope of another protein. This is for obvious reasons more likely with polyclonal antibodies.

Þ Potential solution: Usage of monoclonal antibodies reduces the risk of such cross-reactivity. If you suspect a cross-reactivity of your antibody, using a different clone for the same epitope will likely solve this problem.

(b) Intracellular biotin: Biotin is an important component of the cell metabolism. Therefore, biotin is present in the cells and the use of a streptavidin for intracellular staining will lead to binding of the streptavidin also to the cellular biotin.

Þ Potential solution: If you need to use a biotin-conjugated antibody for your intracellular staining you could cover all intracellular biotin by incubation of your cells with unconjugated streptavidin (followed by thorough washing) before the addition of your biotin-conjugated antibody.

(c) FITC charge: FITC is a charged molecule and antibodies with many FITC molecules (i.e. high F/P ratio) result in a highly charged antibody that binds, presumably through electrostatic interactions, nonspecifically to cytoplasmic elements (Hulspas et al.). This seems to be mainly a problem with intracellular staining and not with surface stains.

Þ Potential solution: For this reason FITC is not ideal for intracellular staining and you might try your antibody conjugated to a different fluorochrome.

(d) CD205: CD205 (DEC205) is a C-type lectin that is highly expressed on dendritic cells. Recently, it has been demonstrated that PE-Cy5.5 binds with high specificity to mouse CD205 (Park et al.). No staining was observed towards human CD205 and the binding of other Cy5.5 conjugates (PerCP-Cy5.5, APC-Cy5.5 and Cy5.5) to mouse CD205 was much weaker than that of PE-Cy5.5 (Park et al.).

Þ Potential solution: Given the high specificity of the interaction, you should avoid the use of PE-Cy5.5, and to a lesser extent other Cy5.5 containing fluorochromes, when your cells of interest expresses mouse CD205.

(4) Other effects

Finally, another odd-ball has been reported for APC tandems. Apparently, living cells have some way, which depends on their metabolism, to degrade the APC-Cy7 and APC-H7 tandems, leaving you with an APC signal (Le Roy et al.). APC-Cy7 seemed to be more affected than APC-H7 and monocytes are more active at degrading this signal than lymphocytes.

Þ Potential solution: Given that this requires live cells, fixation of your cell solution after staining will solve this problem. Alternatively, as this degradation requires metabolically active cells, storing your cell solution at 4°C or on ice or adding sodium azide (NaN3) to your storing buffer will reduce the effect.

That’s all I have for now, but if you know of other such ‘pseudo-artifacts’, or if you have any corrections and comments please share them with us!


//


References:

An amazing source for odd questions on flow cytometry is the ‘Cytometry mailing list’ hosted by the Purdue University, which can be found under: https://lists.purdue.edu/mailman/listinfo/cytometry

Beavis, A.J. & Pennline, K.J., 1996. Allo-7: a new fluorescent tandem dye for use in flow cytometry. Cytometry, 24(4), pp.390–395.

Hulspas, R. et al., 2009. Considerations for the control of background fluorescence in clinical flow cytometry. Cytometry, 76B(6), pp.355–364.

Jahrsdörfer, B., Blackwell, S.E. & Weiner, G.J., 2005. Phosphorothyoate oligodeoxynucleotides block nonspecific binding of Cy5 conjugates to monocytes,

Le Roy, C. et al., 2009. Flow cytometry APC-tandem dyes are degraded through a cell-dependent mechanism. Cytometry A, 75(10), pp.882–890.

Pape, K.A. et al., 2011. Different B cell populations mediate early and late memory during an endogenous immune response. Science, 331(6021), pp.1203–1207.

Park, C.G., Rodriguez, A. & Steinman, R.M., 2012. PE-Cy5.5 conjugates bind to the cells expressing mouse DEC205/CD205. J Immunol Methods, 384(1-2), pp.184–190.

Shapiro, H.M., 2004. Practical Flow Cytometry 4th Edt,

Stewart, C.C. & Stewart, S.J., 2001. Cell preparation for the identification of leukocytes. Methods Cell Biol, 63, pp.217–251.

Takizawa, F., Kinet, J.P. & Adamczewski, M., 1993. Binding of phycoerythrin and its conjugates to murine low affinity receptors for immunoglobulin G. Journal of Immunological Methods, 162(2), pp.269–272.

van Vugt, M.J., van den Herik-Oudijk, I.E. & van de Winkle, J.G., 1996. Binding of PE-CY5 conjugates to the human high-affinity receptor for IgG (CD64). Blood, 88(6), pp.2358–2361.

Wu, C.J. et al., 1991. Murine memory B cells are multi-isotype expressors. Immunology, 72(1), pp.48–55.

Zeng, X. et al., 2012. gd T Cells Recognize a Microbial Encoded B Cell Antigen to Initiate a Rapid Antigen-Specific Interleukin-17 Response. Immunity, 37(3), pp.524–534.


Gerhard WingenderGerhard Wingender is currently an Instructor at the La Jolla Institute for Allergy and Immunology (La Jolla, CA). His main lab toy is flow cytometry and his research interest involve invariant Natural Killer T (iNKT) cells.


//


Photo credit: PNNL – Pacific Northwest National Laboratory / Foter.com / CC BY-NC-SA

Artifacts and non-specific staining in flow cytometry, Part I

If you add your antibody, lets say anti-CD3-epsilon antibody, to your cell solution you’d expect that only T cells will be labeled, right? Well, if it were so easy then it wouldn’t be biology!


antibodiesIn this first half of the two part blog, I will talk about the two reasons, namely unspecific binding and Fc-receptors, which most people think of when they talk about non-specific binding in flow cytometry.

Some lesser known, but intriguing and important, ‘pseudo-artifacts’ will be covered later in Part II of the blog.


(1) Unspecific binding

Unspecific binding is defined as any sticking of an antibody or a fluorochrome to a cell in a fashion that does not require a specifically (currently) defined interaction. This might occur due to electrostatic interactions, glycolipid interaction on the cell membrane, protein-protein interactions and DNA binding.

As such unspecific binding of a cell depends heavily on the surface area (for surface stains) and/or its volume (intracellular staining). For example a cell with twice the size (as seen in the FSC) has 4-times the surface area (SF = 4pi r2) and 8-times the volume (V = 4/3pi r3) and consequently the unspecific binding will be 4 to 8-times higher. So, if you see the whole population shifting a bit in your histogram, you might want to check the scatter of the cells. For example, activated cells start proliferating, which increase their cell size along the way.


Aggravating factors and potential solutions:

Antibody amount: A surplus of antibody can increase the non-specific binding, leading to a reduction in the separation of your positive cells and reducing the signal:noise ratio.

Þ Potential solution: Titrate your antibody. As a starting point, antibodies with the same fluorochrome conjugate can often be used at similar concentrations.

Extracellular matrix/cell content: All cells bind proteins including antibodies to some degree via various interactions

Þ Potential solution: Addition of protein to the wash and staining solutions will cover many of these binding sites. Most staining protocols include BSA or serum (either human or FCS) for this purpose.

Dead cells: Dead cells are notorious for non-specifically binding antibodies and appear very ‘sticky’. This is partially due to DNA, but including DNAse would only partially solve the problem.

Þ Potential solution: A live/dead differentiation should be included, if possible, in every staining. Dead cells cannot be entirely separated just by FSC/SSC characteristics, especially not after fixation. Keep in mind though, that fixation of your cells after staining with e.g. PI or 7AAD will partially permeabilize all your cells, so that PI or 7AAD can leak out of the labeled cells to other cells eventually homogenously staining all your cells. In the case of 7AAD this can be avoided by inclusion of non-fluorescent actinomycin D (Schmid et al.). However, nowadays multiple live/dead discriminating reagents are available that can be fixed, thereby stopping potential leakage and avoiding this problem altogether.


(2) Binding of antibodies to Fc-receptors:

Obviously Fc-receptors (FcR) bind antibodies with high specificity, but the common misconception is that this is solely species-specific. However, FcRs from one species readily bind antibodies from other species to varying degrees. For example, hamster anti-mouse CD3-epsilon (clone 145.2C11) can bind to all mouse FcRs (Wingender et al.).

Þ Potential solution:

(a)   Fab or F(ab)2 fragments: Utilizing antibodies without their Fc-end avoids the problem altogether, but most commercially available antibodies do contain their Fc part.

(b)   ‘Fc-Block’: Adding antibodies that are specific for particular FcRs that block the undesired interaction with your experimental antibody. However, the ‘Fc-block’ commonly used for mice is the blocking monoclonal antibody 2.4G2 (rat IgG2b kappa) which is specific for mouse Fc-gamma-RII  (CD16) and Fc-gamma-RIII (CD32). Therefore, other FcRs are not directly blocked by 2.4G2. However, the majority of commercial antibodies are of an IgG subtype, most of the potential unspecific Fc-binding will be blocked by 2.4G2. Similar products for staining of human cells are widely available.

(c)     Unconjugated antibody: Adding unconjugated antibody of the same species and isotype as your experimental antibody to your staining cocktail will saturate most potential FcR binding sites.

As a positive side effect, adding unconjugated antibodies, either 2.4G2 or any other isotype, to your stain will incidentally also saturate most other potential unspecific bindings, as they were outlined under (1). Therefore, adding unconjugated antibody to your surface and also your intracellular staining cocktails will reduce unspecific binding.


So much for part one. As always, corrections and comments are highly welcomed.


References:

Schmid, I. et al., 2001. Simultaneous flow cytometric measurement of viability and lymphocyte subset proliferation. J Immunol Methods, 247(1-2), pp.175–186.

Wingender, G. et al., 2006. Rapid and preferential distribution of blood-borne alphaCD3epsilonAb to the liver is followed by local stimulation of T cells and natural killer T cells. Immunology, 117(1), pp.117–126.


//


Gerhard WingenderGerhard Wingender is currently an Instructor at the La Jolla Institute for Allergy and Immunology (La Jolla, CA). His main lab toy is flow cytometry and his research interest involve invariant Natural Killer T (iNKT) cells.


//


References:

Schmid, I. et al., 2001. Simultaneous flow cytometric measurement of viability and lymphocyte subset proliferation. J Immunol Methods, 247(1-2), pp.175–186.

Wingender, G. et al., 2006. Rapid and preferential distribution of blood-borne alphaCD3epsilonAb to the liver is followed by local stimulation of T cells and natural killer T cells. Immunology, 117(1), pp.117–126.


Photo credit: AJC1 / Foter.com / CC BY-NC-SA