Using Mass Spectrometry for Mass T cell Epitope Discovery

Time of Flight Mass Cytometry (CyTOF) is a relatively new multiparametric technology that is far outpacing standard fluorescence-based flow cytometry in the number of parameters that can be simultaneously assessed on a single cell.  In CyTOF, rare transition element isotope-conjugated antibodies are used to label cellular antigens of interest, the magnitude of which is then quantitated by a time of flight mass cytometer, as discussed previously. Previous studies assessing 34 cell surface and intracellular proteins by this technology demonstrated the existence of high dimensional complexity in the heterogeneity of human bone marrow and CD8+ T cell populations.  In a July 2013 article in Nature Biotechonology, Newell et al., move CyTOF and the field of immunology another technological step forward by utilizing CyTOF to measure the frequencies of Rotavirus antigen-specific T cells in human peripheral blood mononuclear cells (PBMCs) and jejunal tissue with peptide-MHC tetramers.

In CyTOF, the theoretical maximum number of simultaneously assessable parameters is 100-200 depending on the instrument.  This vastly outnumbers the assessable parameters of standard fluorescence-based flow cytometry.  To date however, only approximately 40 metal ions have been utilized for antibody labeling, and the development of further metal-chelating technologies is awaited in order to utilize the maximum capacity of the CyTOF instrument.  In the current study, the authors circumvent this limitation by using a “bar-coding” methodology in which a variant combination of three out of ten metal ions are used for labeling each tetramer, allowing for up to 120 different metal combinations.

In this study, the authors sought to identify Rotavirus epitopes recognized by human CD8+ T cells in the context of the MHC class I allele, HLA-A*0201.  To date, only two Rotavirus epitopes recognized by T cells have been identified, and little is known about the phenotypic and functional diversity of antigen-specific T cells for any particular pathogen.  The technical difficulties in proper epitope prediction along with the limited number of cells attainable from human blood samples contribute to these issues.  Thus, this method represents a huge leap forward in the potential to identify significantly more antigen-specific T cell epitopes and to extensively classify these cells functionally.  Using an MHC-prediction algorithm, 77 possible Rotavirus peptides were identified that bound to HLA-A*0201.  An additional 32 positive and negative control tetramers were added for a total of 109 labeled tetramers used to stain each sample simultaneously.  This was further combined with 23-27 metal-chelated antibodies specific for cell surface and intracellular antigens to phenotypically characterize the T cells. A specialized Matlab script was used to analyze the high-dimensional data obtained following mass spectrometry of PBMC and jejunal samples.

On average, CD8 T cell populations specific for two Rotavirus-peptides plus 6-7 peptides from other viruses including influenza, EBV, and CMV, were identified on average across PBMCs from the 17 healthy donors analyzed.  These antigen-specific T cell populations were further phenotypically characterized by expression of surface and intracellular markers.   CD8 T cells specific for six Rotavirus epitopes that included the two previously identified epitopes, were recurrently detected in PBMCs from at least two individuals.  Of these, CD8 cells specific for a Rotavirus peptide from the VP3 protein were most common among healthy donor PBMCs and were phenotypically unique, being of the effector memory subtype compared with a central memory phenotype typical of the T cells specific for the other Rotavirus peptides.  VP3-specific T cells were also uniquely present in jejunal tissue obtained from obese patients that had undergone gastric bypass surgeries.  Thus, this methodology discovered at least 4 new Rotavirus peptides as well as unique characteristics of the different antigen-specific CD8 T cell populations.

In summary, this methodology of combining CyTOF technology with tetramer “bar-coding” paves the way for a vast expansion over fluorescent-based flow cytometry techniques for identifying antigen-specific T cell populations.  As vaccine strategies are an ongoing goal for treatment and prevention of infectious diseases and cancer, it is important to not only identify the peptides that can elicit T cell responses, but also functionally characterize these T cells in order to maximally promote desired immune responses.

Further  Reading:

Combinatorial tetramer staining and mass cytometry analysis facilitate T-cell epitope mapping and characterization.  Newell EW, Sigal N, Nair N, Kidd BA, Greenberg HB, Davis MM. Nat Biotechnol. 2013 Jul;31(7):623-9. doi: 10.1038/nbt.2593. Epub 2013 Jun 9.

Cracking the code of human T-cell immunity.  Harvey CJ, Wucherpfennig KW. Nat Biotechnol. 2013 Jul 9;31(7):609-10. doi: 10.1038/nbt.2626.

Cytometry by time-of-flight shows combinatorial cytokine expression and virus-specific cell niches within a continuum of CD8+ T cell phenotypes. Immunity. 2012 Jan 27;36(1):142-52. doi: 10.1016/j.immuni.2012.01.002.

Single-cell mass cytometry of differential immune and drug responses across a human hematopoietic continuum.  Bendall SC, Simonds EF, Qiu P, Amir el-AD, Krutzik PO, Finck R, Bruggner RV, Melamed R, Trejo A, Ornatsky OI, Balderas RS, Plevritis SK, Sachs K, Pe’er D, Tanner SD, Nolan GP. Science. 2011 May 6;332(6030):687-96. doi: 10.1126/science.1198704.

Whole Blood Phospho-flow: Direct Ex Vivo Measurement of Signaling in PBMC

I previously discussed phospho-flow cytometry, a method to study intracellular protein phosphorylation events in peripheral blood mononuclear cells (PBMC) at the single cell level.  In standard phospho-flow cytometry protocols, prior to performing assays, PBMCs are first isolated from blood using density gradient centrifugation methods such as Ficoll.  However, there may be times when it is advantageous to study signaling pathways in relatively unmanipulated cells directly ex vivo.  For this, Chow et al. have established a protocol for performing phospho-flow cytometry on PBMCs directly in whole blood.

phospho_flow_cytometry

There are many advantages to isolating and cryopreserving PBMCs with the intention of later studying signaling events by methods including standard phospho-flow cytometry.  In particular, when comparisons are desired between patient groups and healthy controls, there is likely to be less confounding contributions of experimental variability to the results if all of the comparative samples are assayed together.  However, as discussed by Chow et al., pharmacodynamic monitoring as well as evaluation of constitutively activated signaling pathways in PBMCs would be best studied on cells having undergone the least manipulation.  Some signaling pathway responses may be more robust in whole blood PBMCs as well.  For example, I have found in my own assays that signaling responses to IL-6 are strongest in whole blood PBMCs compared with PBMCs following Ficoll or culture in the incubator for any amount of time.  This method can also be used to study bone marrow immune cell signaling as well as expression of intracellular molecules that are exposed by the permeabilization method chosen. In addition, looking at signaling events in murine PBMCs is difficult to do if PBMCs need to be isolated first, given the very small amount of blood that can be obtained from a mouse.  In these cases, anti-coagulated whole blood phospho-flow cytometry should be considered.

Whole blood phospho-flow cytometry is a relatively easy method.  Using 100 ul of whole blood is enough for this assay, and the stimulus (cytokine or other activating signaling molecule) is added directly to the whole blood for the preferred amount of time.  PBMCs are then fixed with formaldehyde and a Triton X-100 based buffer is added to lyse the red blood cells and permeabilize the white blood cells.  This is followed with a few washes and finally the cells can be treated with methanol to unmask phospho-epitopes, similarly to the standard phospho-flow cytometry method by Nolan and colleagues.  Chow et al. include an optional step in which the PBMCs can be stored in a freezing buffer prior to methanol treatment.  However, I have successfully stored PBMCs in 90-100% methanol at -20 or -80 ºC until staining for flow cytometry, similarly to what is done for the standard phospho-flow cytometry method by Nolan and colleagues.

As with all protocols involving treatment of cells with reagents such as methanol or Triton X-100, some epitopes may be lost and thus will not be evaluable if staining is done following these treatments.  Thus, there is an alternate method included in the protocol to stain for some antigens up front.  As a reminder however, some fluorophores are sensitive to methanol, for instance V500, and thus cannot be used to stain PBMCs prior to such treatments.  Finally, in a prior article, Chow et al. (2005), tested different methods of fixation, permeabilization and alcohol unmasking, and I have included the link to that article below as an excellent reference in the case that modulation of the protocol is required for optimal assessment of your antigens of interest.

Further Reading:

Whole blood processing for measurement of signaling proteins by flow cytometry.  Chow S, Hedley D, Shankey TV. Curr Protoc Cytom. 2008 Oct;Chapter 9:Unit 9.27.

Whole blood fixation and permeabilization protocol with red blood cell lysis for flow cytometry of intracellular phosphorylated epitopes in leukocyte subpopulations.  Chow S, Hedley D, Grom P, Magari R, Jacobberger JW, Shankey TV. Cytometry A. 2005 Sep;67(1):4-17.

Single-cell phospho-protein analysis by flow cytometry. Schulz KR, Danna EA, Krutzik PO, Nolan GP.Curr Protoc Immunol. 2012 Feb;Chapter 8:Unit 8.17.1-20.


Considerations for measuring cytokine levels in serum or plasma

Changes in circulating cytokine and chemokine levels have been associated with many human diseases, and thus understanding the relationships between these changes and disease is an important area of medical research.  Circulating levels of these proteins or other chemistries are measured from plasma or serum collected from peripheral blood draws.  It is important to note that the methods of sampling and storage of plasma or serum are critical for accurate measurements.  Here are some important considerations when planning to measure the levels of cytokines and chemokines in serum or plasma.

Blood collection tubes are available in a choice of factors and should blood tubesbe selected based on the analysis being done, as different anti-coagulants support different chemistries.  Plasma is collected from blood drawn into tubes containing anticoagulants, including sodium or lithium heparin which act to inhibit thrombin from blood clotting, or sodium citrate or EDTA which chelate calcium ions to prevent coagulation.  Serum collection tubes contain clot activators, however this method does not allow collection of peripheral blood mononuclear cells (PBMCs) from the same vial, which means that oftentimes, plasma will be the product of choice to maximize the value of blood drawn in a minimal number of tubes from study participants and healthy donors.

luminex service 2Following collection, plasma or serum should be cryopreserved at -80º C.  Cytokines and chemokine levels can be measured by Enzyme-linked immunosorbent assay (ELISA).  However, this method is time consuming and allows measurement of only one factor at a time.  Luminex, a bead-based multiplex assay, can measure up to 100 cytokines, chemokines, or other soluble proteins at a time. Thus, for a given disease cohort, multitudes of measurements can be made from a single small sample of serum or plasma.  Notably, many cytokines and chemokines exist in very low levels in peripheral blood, thus for each cytokine or chemokine to be measured it is important to determine if the detection range of the assay used is sufficient for the known range of circulating levels of that protein.  Also, levels of these proteins may differ depending on whether they were measured in serum or plasma collected in various anticoagulants, so determinations should be done using the most similar methodologies as comparisons.

A methodology paper by de Jager et. al, discusses several important considerations for analyzing cytokine levels from serum or plasma by Luminex.  In this paper, due to unmeasurably low levels of many cytokines, to allow for more dynamic determinations, whole blood was spiked with recombinant cytokines, or treated with LPS for a time period to upregulate expression of cytokines, prior to plasma collection, cryopreservation, and Luminex assays.

One comparison made was the difference in profiles of 15 cytokines in serum, versus plasma from the same donors collected in sodium heparin, EDTA, or citrate.  Overall, cytokine levels were similar with a few exceptions, including IL-6 having the lowest values in serum compared with plasma, while CXCL8 was significantly higher in serum.  The authors concluded that plasma collected in sodium heparin allowed the best measurements overall for the cytokines assessed.  The time it takes to process and store samples after blood collection may also influence cytokine levels and should be done as consistently as possible for the most robust comparisons.

Another hugely important factor is sample storage time.  As with all assays, experimental variation should be minimized, and thus it is common to store plasma or serum samples until the entire cohort has been collected and then analyze all of the samples simultaneously.  This also comes into play when changes in cytokine profiles over time are to be measured from serial samples from an individual. The authors measured cytokine levels from sodium heparin plasma stored at -80º C over time, for up to four years.  Several cytokines including IL-13, IL-15, IL-17 and CXCL8 began to be degraded within one year of storage, while levels of IL-1α, IL-1β, IL-5, IL-6, and IL-10 were degraded by over 50% in 2-3 yearsIL-2, IL-4, IL-12 and IL-18 were much more stable, maintaining their initial levels out to 3 years post initial storage.  Thus, depending on the cytokines being analyzed it is critical to keep these issues in mind.  These are the same issues that are faced with storage of recombinant proteins that are used to generate the ELISA or Luminex standard curves or in other cytokine assays.

Stability of cytokines following several rounds of freeze-thawing were also assessed.  Almost all of the cytokines analyzed with the exception of IL-6 and IL-10 were affected by freeze thawing the samples.  Thus, when storing plasma or serum samples, it is important to freeze the samples in multiple aliquots such that additional assays can be performed while avoiding this issue.

In conclusion, handling and storage of serum and plasma samples as well as the choice of serum versus plasma collected in different anti-coagulants are all important factors to consider when planning for studies that will include measurement of circulating cytokines and chemokines.

Further Reading:

Prerequisites for cytokine measurements in clinical trials with multiplex immunoassays.  de Jager W, Bourcier K, Rijkers GT, Prakken BJ, Seyfert-Margolis V. BMC Immunol. 2009 Sep 28;10:52. doi: 10.1186/1471-2172-10-52.


Identification of Type I Innate Lymphoid Cells that functionally resemble TH1 and NK cells

Innate lymphoid cells (ILCs) are subsets of lymphoid cells that do not rearrange their antigen receptors like T cells and B cells but have other features of lymphocytes.  ILCs include the Natural Killer (NK) cell subset, as well as cells that behave similarly to T helper cell subsets by producing similar characteristic cytokines.  Type 2 ILCs (ILC2) resemble TH2 describe the imagecells in that they produce IL-5 and IL-13.  RORγt+ ILCs aka ILC3s, include subsets that resemble TH17 and TH22 cells by producing IL-17 and IL-22, respectively, as well as a subset that produces both cytokines.   Several recent articles have identified another class of ILCs in both humans and mice.  These cells resemble TH1 cells in that they express T-bet/TBX21 and produce IFN-gamma, and are distinct from conventional NK cells found among peripheral blood mononuclear cells (PBMC).  These newly characterized cellular subsets have been denoted as Type 1 ILCs (ILC1).

In the April 2013 issue of Immunity, Fuchs et. al sought to more fully characterize the ILC subsets present in human mucosal lymphoid tissues.  In human tonsils, a CD3CD56+ NKp44+CD103+ subset was identified that expressed T-bet and produced IFN-gamma when stimulated with either PMA/ionomycin, IL-12, or IL-15.  These cells also expressed perforin and granzyme and had cytolytic activity.  Although these cells express CD56+and NKp44+, which are markers characteristic of NK cells, they appear to be related to but distinct from prototypical CD56hi NK cells found in PBMC.  For instance, unlike CD56hi PBMC NK cells, these ILC1 did not exhibit a response to IL-18, as measured by a synergistic production of IFN-gamma when stimulated with IL-12+ IL-18 vs. IL-12 alone.

In a separate study, published in the March 2013 issue of Nature Immunology, Bernink et. al identified a mucosal human ILC1 subset in tonsils that differs from that found by Fuchs et. al, being CD56NKp44as well asCD127+ and c-Kit.  Similarly to the cells described by Fuchs et. al, these cells expressed T-bet and produced  IFN-gamma when stimulated with PMA/ionomycin or IL-12.  However, they did not express perforin and granzyme.  Additional characterizations differentiated these cells from NK cells including the lack of the KIR3DL1 and IL-15Rα markers expressed by NK cells.

ILCs have been found to reside in mucosal associated lymphoid tissues include the oral, lung, and gastrointestinal mucosa, and are thought to function in immune responses to pathogens as well as in tissue repair.  ILCs including ILC3s have also been found to participate in inflammatory disease pathogenesis.  Both types of ILC1 cells were shown to be increased in the intestinal mucosa of Crohn’s disease patients, although their exact locations differed.  CD56+ NKp44+CD103+ cells were found to accumulate in the intraepithelial layer while CD127+CD56c-KitNKp44cells were found in the lamina propria.  Thus, these two subsets of ILC1 cells differ in multiple aspects including tissue localization.

In conclusion, both types of ILC1 cells identified in these studies are distinct from conventional PBMC CD56hi NK cells, express T-bet, and produce IFN-gamma in response to IL-12 and IL-15 stimulation.  Notably, ILC3 cells also heterogeneously express CD56, IFN-gamma, granzymes and perforin.  Thus, many questions remain as to the functional and developmental differences between different ILC subsets and between CD56+ ILC1 cells and PBMC NK cells that reside in various tissues.

Reading:

Intraepithelial Type 1 Innate Lymphoid Cells Are a Unique Subset of IL-12- and IL-15-Responsive IFN-γ-Producing Cells.  Fuchs A, Vermi W, Lee JS, Lonardi S, Gilfillan S, Newberry RD, Cella M, Colonna M. Immunity. 2013 Apr 18;38(4):769-81.

Human type 1 innate lymphoid cells accumulate in inflamed mucosal tissues.  Bernink JH, Peters CP, Munneke M, te Velde AA, Meijer SL, Weijer K, Hreggvidsdottir HS, Heinsbroek SE, Legrand N, Buskens CJ, Bemelman WA, Mjösberg JM, Spits H.  Nat Immunol. 2013 Mar;14(3):221-9.

ILC1 Populations Join the Border Patrol.  Maloy KJ, Uhlig HH. Immunity. 2013 Apr 18;38(4):630-2. doi: 10.1016/j.immuni.2013.03.005.

Innate lymphoid cells: emerging insights in development, lineage relationships, and function.  Spits H, Cupedo T. Annu Rev Immunol. 2012;30:647-75.

A T-bet gradient controls the fate and function of CCR6-RORγt+ innate lymphoid cells.  Klose CS, Kiss EA, Schwierzeck V, Ebert K, Hoyler T, d’Hargues Y, Göppert N, Croxford AL, Waisman A, Tanriver Y, Diefenbach A.  Nature. 2013 Feb 14;494(7436):261-5.

Going Serum-Free in Cryopreserving PBMCs: Better Immunoassay Performance?

Probably the most common way to cryopreserve cells, including human peripheral blood mononuclear cells (PBMC) is using a mixture of 90% serum with 10% DMSO.  However, serum is very expensive, and every new lot must first be tested for its effects on the background and performance of the various cellular assays performed.  A recent article in Cancer, Immunology, Immunotherapy, by Filbert et. al, reports on the results of an effort led by the Cancer Immunotherapy Immunoguiding Program to compare the viability, recovery, and performance in IFN-gamma ELISPOT assays of PBMCs cryopreserved in serum-containing versus various serum-free mediums.

This was a large-scale study which engaged 31 labs across ten countries.  This study is part of a larger concerted effort by the Immunoguiding Program of the Cancer Immunotherapy Association and the Cancer Research Institute’s Cancer Immunotherapy Consortium to assess the importance of harmonizing the most commonly utilized immunological assays across institutions, such that standardized results can be obtained.  The major inertia driving this effort is to establish a platform for standardized evaluation of patient immune responses to support the growing field of clinical immunotherapeutics.

In this study, three different freezing media were compared in 31 labs and seven freezing media were compared in a single center.  Human PBMCs from HLA-A*0201 donors were cryopreserved in these various freezing mediums and sent to the different labs for evaluation of viability, recovery, and performance in IFN-gamma ELISPOT protocols against several HLA-A*0201-restricted epitopes from HCMV, Influenza, and EBV viruses.  Each lab used its own established ELISPOT protocol.

All 31 labs compared PBMCs cryopreserved in (1) 90 % heat-inactivated human AB serum + 10 % DMSO, (2) CryoMaxx II, and (3) 10 % human serum albumin (HSA) + 10 % DMSO + 80 % RPMI.  Interestingly, the viability of cells after thawing as well as the number of cells recovered after thawing and after a 1-24 hour rest, were found to be significantly higher in both serum-free mediums compared to the human AB serum-containing media.  The overall cell loss from the number of cells initially cryopreserved ended up being an average of 35.2 % for PBMCs cryopreserved in the human AB serum-containing media, and roughly 22% for both of the serum-free mediums.  Thus, these assays suggest that these serum-free mediums provide more optimal freezing conditions compared with the human AB serum-containing media.  The performance in ELISPOT assays however, was not found to be significantly different for cells frozen in these different mediums.

In addition to those three mediums, a single laboratory made the same assessments for PBMCs cryopreserved in an additional four mediums: (4) CryoKit ABC, (5) 90 % heat-inactivated FCS + 10 % DMSO, (6) 12.5 % BSA + 77.5 % RPMI + 10 % DMSO, and (7) 12.5 % BSA + 77.5 % RPMI + 5 % DMSO + 5 % hydroxyethyl starch. In this comparison however, serum-free and serum-containing mediums had similar effects on viability, cell recovery, and in the ELISPOT assay, although the BSA-containing mediums had the worst performance overall.

In conclusion, although commonly used FBS and FCS-containing mediums were not compared in the multi-lab test, the strong performance of cells cryopreserved in serum-free media regarding subsequent viability, recovery, and in ELISPOT assays recommends that further consideration be given to cryopreservation in such serum-free media. Long term storage quality of cells frozen in various serum-free media is still an issue to be addressed as well as the comparative performance of PBMCs in the many other immunological assays.  Using defined serum-free media as opposed to lot-variant serum-containing media may allow for more robust standardization of immunological assays.

Serum-free freezing media support high cell quality and excellent ELISPOT assay performance across a wide variety of different assay protocols.  Filbert H, Attig S, Bidmon N, Renard BY, Janetzki S, Sahin U, Welters MJ, Ottensmeier C, van der Burg SH, Gouttefangeas C, Britten CM. Cancer Immunol Immunother. 2013 Apr;62(4):615-27. doi: 10.1007/s00262-012-1359-5. Epub 2012 Nov 9.

The impact of harmonization on ELISPOT assay performance.  Janetzki S, Britten CM. Methods Mol Biol. 2012;792:25-36. doi: 10.1007/978-1-61779-325-7_2.

Harmonization of immune biomarker assays for clinical studies.  van der Burg SH, Kalos M, Gouttefangeas C, Janetzki S, Ottensmeier C, Welters MJ, Romero P, Britten CM, Hoos A. Sci Transl Med. 2011 Nov 9;3(108):108ps44. doi: 10.1126/scitranslmed.3002785.

Standardized Serum-Free Cryomedia Maintain Peripheral Blood Mononuclear Cell Viability, Recovery, and Antigen-Specific T-Cell Response Compared to Fetal Calf Serum-Based Medium.  Germann A, Schulz JC, Kemp-Kamke B, Zimmermann H, von Briesen H. Biopreserv Biobank. 2011 Sep;9(3):229-236.

Antigen Cross-Presentation by Human Dendritic Cell Subsets

Dendritic cells (DC) are major antigen-presenting cells consisting of numerous heterogeneous subtypes.   In humans, several subtypes of DCs have been identified in different tissues including peripheral blood, secondary lymphoid organs, and in the skin.  In peripheral blood mononuclear cells (PBMC) and secondary lymphoid organs, these subtypes include BDCA1+, BDCA3+, and plasmacytoid DCs which differ functionally and in expression of various markers. So how do these many human DC subsets differ functionally?

Antigen crossdescribe the image-presentation is a DC-specialized mechanism by which antigens are taken up through endocytic and phagocytic pathways but presented in the context of MHC-class I, to activate antigen-specific cytotoxic CD8 T cells.  Recent studies have sought to characterize the differences between the many tissue-associated DC subsets including their ability to cross-present antigen.

In PBMC, DCs are quite rare, comprising only 1 – 2% of PBMCs.  In previous blog posts, the generation of dendritic cells from PBMC monocytes and maturing and assaying monocyte-derived dendritic cells have been discussed.  However, blood DCs and in vitro generated DCs may not represent the true physiological state of DCs present in secondary lymphoid organs where natural antigen cross-presentation and T cell activation occur in vivo.

In a recent study in The Journal of Experimental Medicine, Segura et. al explored the antigen cross-presentation versus phagocytic capabilities of human BDCA1+, BDCA3+, and plasmacytoid DC subsets compared with CD11c+HLADR+CD14+ macrophages that were all freshly isolated from healthy donor tonsils.  The cross-presentation capabilities of different types of antigens, including necrotic dead cell antigens and soluble antigens were assessed.

For necrotic dead cell antigens, such as dead tumor cells, BDCA1+ and BDCA3+ DC subsets both took up antigens to a similar extent and were the most efficient in activating CD8+ T cell responses which were measured by IFN-gamma production in allogeneic mixed leukocyte reaction assays.  Macrophages far exceeded the ability of any DC subsets in dead cell phagocytosis, but were extremely poor at cross-presentation and CD8+ T cell activation.  Plasmacytoid DCs were the poorest at phagocytosis of dead cells, and were also unable to cross-present these antigens.  For soluble antigens however, all three DC subsets (BDCA1+, BDCA3+, and plasmacytoid DC) efficiently cross-presented both shorter and longer soluble peptides, while macrophages continued to be poor at cross-presentation.

In an additional set of assays, the authors explored mechanisms that may contribute to the differential phagocytosis versus antigen cross-presentation of DC subsets and macrophages.    Compared with macrophages which did not cross-present antigens, the endocytic compartments of cross-presenting DCs kept an alkaline pH and contained reactive oxygen species, and these DCs further were able to export internalized antigens to the cytosol where they can be loaded onto MHC-class I.  Thus, while macrophages are efficient phagocytes, they are unable to process antigens to allow for cross-presentation.

In conclusion, understanding the capabilities of immune cells in different tissues is critical to discovering the full spectrum of cellular functions.  DCs are a major target for vaccinations and immunotherapeutic strategies, and describing and understanding these subsets in vivo will lead to maximized success in immune modulating modalities.

Further Reading:

Similar antigen cross-presentation capacity and phagocytic functions in all freshly isolated human lymphoid organ-resident dendritic cells.  Segura E, Durand M, Amigorena S. J Exp Med. 2013 Apr 8.

Cross-presentation by dendritic cells.  Joffre OP, Segura E, Savina A, Amigorena S.  Nat Rev Immunol. 2012 Jul 13;12(8):557-69. doi: 10.1038/nri3254. Review.

BDCA-2, BDCA-3, and BDCA-4: three markers for distinct subsets of dendritic cells in human peripheral blood. Dzionek, A., A. Fuchs, P. Schmidt, S. Cremer, M. Zysk, S. Miltenyi, D.W. Buck, and J. Schmitz. 2000. J. Immunol. 165:6037–6046.

Characterization of resident and migratory dendritic cells in human lymph nodes.  Segura, E., J. Valladeau-Guilemond, M.H. Donnadieu, X. Sastre-Garau, V. Soumelis, and S. Amigorena. 2012. J. Exp. Med. 209:653– 660.

Gene family clustering identifies functionally associated subsets of human in vivo blood and tonsillar dendritic cells. Lindstedt, M., K. Lundberg, and C.A. Borrebaeck. 2005. J. Immunol. 175:4839–4846.

Functional specializations of human epidermal Langerhans cells and CD14+ dermal dendritic cellsKlechevsky, E., R. Morita, M. Liu, Y. Cao, S. Coquery, L. Thompson- Snipes, F. Briere, D. Chaussabel, G. Zurawski, A.K. Palucka, et al. 2008. Immunity. 29:497–510.

Characterization of dermal dendritic cells obtained from normal human skin reveals phenotypic and functionally distinctive subsets. Nestle, F.O., X.G. Zheng, C.B. Thompson, L.A. Turka, and B.J. Nickoloff. 1993. J. Immunol. 151:6535–6545.

Expansion of NK cells from Human PBMC

Natural killer (NK) cells represent up to 15% of human peripheral blood mononuclear cells (PBMC), and range from 5-20% of peripheral blood lymphocytes.  NK cells generally fall into three subtypes: CD56dim CD16+, CD56brightCD16+/- and CD56 CD16+ NK cells, the prevalence and functions of which I have previously discussed.  NK cells are considered to be a promising avenue in cell-based anti-tumor immunotherapeutics.  However, the relatively low numbers of these cell types in PBMC have constituted a technical challenge in these efforts and in other studies needing large numbers of NK cells.  In the April 2013 issue of Clinical & Experimental Immunology, Wang et. al, describe an in vitro method for the preferential expansion of human NK cells from PBMC.

NK cell expansion in vitro systems requires multiple signals for survival, proliferation, and activation.  In a previous study, Fujisaki et. al (200describe the image9) demonstrated that highly cytotoxic CD56+ NK cells could be highly preferentially expanded when cultured with a version of the chronic myeloid leukemia K562 cell line, which was genetically altered to express a membrane-bound form of IL-15 and the 41BB ligand (CD137L).  Under this protocol, NK cells expanded an average of 21.6-fold after 7 days and 277-fold after 21 days in culture, and at 21 days reached a purity of 98.6%.  CD3+ T cells on the other hand fell to an average of 3.1% of the cells remaining after 21 days.  Importantly however, is not only the expansion of NK cells, but the functionality of the expanded cell product.  The NK cells generated by this method had enhanced killing potential in vitro.  In xenograft models of acute myeloid leukemia (AML) in immune deficient NOD/scid-IL2RGnull mice, these NK cells were able to elicit potent anti-leukemic activity.  Thus, this method generates large numbers of highly functional human NK cells.

In the current study by Wang et. al, a similar method was utilized in which the K562 cell line was engineered to express a membrane-bound form of IL-21 along with CD137L.  On average under these conditions, NK cells expanded from less than 30% of PBMC to over 85% after 7 days and 95% after 3 weeks, while CD3+ T cells went from 60% initially to 6% at seven days and 1% at three weeks.  Proliferation of NK cells was continual over eight weeks in culture, and by 3 weeks reached over 100-fold, although the exact numbers and ranges were not explicitly stated in the paper.  Thus, NK cells are highly selectively expanded using this method, similarly to the method used by Fujisaki et. al.

In answer to the functionality of NK cells generated under these conditions, Wang et. al demonstrated enhanced expression of activating and inhibitory NK receptors.  Significantly enhanced cytotoxic killing potential after culture was shown, being maximal after one and three weeks in culture whereafter it decreased but still remained higher than resting NK cells.  Thus, these expanded NK cells are also highly functional.

It would be interesting to see a direct comparison of the extent and quality of NK cell expansion from human PBMC by CD137L combined with the membrane-bound form of IL-15 as was done by Fujisaki et. al versus the membrane-bound form of IL-21 developed by Wang et. al.  IL-21 is a strong and preferential activator of STAT3.  Wang et al did establish a role for STAT3 in the induction of these cells.  IL-15 is a strong activator of STAT5 and activates STAT3 to a lesser extent.  However, IL-15 has been shown to strongly induce expression of the STAT3-activating cytokine IL-10.  Thus, for optimal clinical applications of expanded NK cells, it is important to determine how the different cytokine-STAT signals contribute to NK cell proliferation, survival, and activation.

Further Reading:

Membrane-bound interleukin-21 and CD137 ligand induce functional human natural killer cells from peripheral blood mononuclear cells through STAT-3 activation.  Wang X, Lee DA, Wang Y, Wang L, Yao Y, Lin Z, Cheng J, Zhu S. Clin Exp Immunol. 2013 Apr;172(1):104-12. doi: 10.1111/cei.12034.

Expansion of highly cytotoxic human natural killer cells for cancer cell therapy.  Fujisaki H, Kakuda H, Shimasaki N, Imai C, Ma J, Lockey T, Eldridge P, Leung WH, Campana D. Cancer Res. 2009 May 1;69(9):4010-7. doi: 10.1158/0008-5472.CAN-08-3712. Epub 2009 Apr 21.

Natural Killer Cell subtypes and markers in human PBMC

Types of immune cells present in human PBMC

Prospects for the use of NK cells in immunotherapy of human cancer.  Ljunggren HG, Malmberg KJ. Nat Rev Immunol. 2007 May;7(5):329-39.

Properties of the K562 cell line, derived from a patient with chronic myeloid leukemia.  Klein E, Ben-Bassat H, Neumann H, Ralph P, Zeuthen J, Polliack A, Vánky F. Int J Cancer. 1976 Oct 15;18(4):421-31.

Characterization of cytokine differential induction of STAT complexes in primary human T and NK cells.  Yu CR, Young HA, Ortaldo JR. J Leukoc Biol. 1998 Aug;64(2):245-58.

IL-15-induced IL-10 increases the cytolytic activity of human natural killer cells.  Park JY, Lee SH, Yoon SR, Park YJ, Jung H, Kim TD, Choi I. Mol Cells. 2011 Sep;32(3):265-72. doi: 10.1007/s10059-011-1057-8. Epub 2011 Jul 29.

Are Terminally Differentiated Effector Memory Cells present in those “Naïve” CD4+ T cells you isolated from human PBMC?

Immunologists study many aspects regarding differentiation of T cells and function of T cell lineages.  The results and interpretations from these studies always rely on the robustness of the experimental setup.  A question that I posed to myself recently, when testing protocols for differentiation of naïve CD4+ T cells into various functional lineages (TH1, TH2, TH17, TREG), was whether or not CD4+ terminally differentiated effector memory (TEMRA) cells are still present in the population of “naïve” CD4+ T cells obtained following isolation from peripheral blood mononuclear cells (PBMC).

Following antigen exposure, CD4+ and CD8+ T cells undergo differentiation thorough various stages.  While the exact path of differentiation remains under exploration, a current mainstream hypothesis is that naïve cells (TN) progress through central memory (TCM), then effector memory (TEM), then finally terminally differentiated effector memory (TEMRA) states.  Expression of surface markers have been used to identify human T cells in these various states, including CD45RA, CD45RO, CCR7, CD62L, CD27, and CD28.  After antigen exposure, naïve T cells, which are CD45RA+CD45ROCCR7+CD62L+CD27+CD28+ lose expression of CD45RA and gain expression of CD45RO.  As memory T cells progress from TCM to TEM cells, they additionally lose expression of CCR7, CD45RA+, CD27, and CD28.  Finally, TEMRA cells regain expression of CD45RA, but remain identifiable from naïve T cells by their lack of CCR7, CD62L, CD27, and CD28 expression.

The function of CD4+ TEMRA cells parallels that of CD8+ TEMRA cells.  These cells are cytolytic and express IFN-gamma after activation through their TCR or stimulation with PMA/ionomycin. CD4+ TEMRA cells also have shorter telomeres than naïve, TCM, and TEM populations, and lower homeostatic proliferation capacity.

While TEMRA cells are well described for CD8+ T cells, they often are ignored as part of the CD4+ compartment.  Despite the lack of attention that  CD4+ TEMRA cells are given in the literature, I observe them quite frequently in human PBMC from healthy donors, on average being 4% of CD4+ T cells (range 0-15%) and 11% of CD4+CD45RA+ cells (range 0-40%).  Additionally, the percentage of CD4+ TEMRA cells that I observe has a strong correlation with IFN-gamma production by CD4+CD45RA+ T cells from the same donor.

CD4 naive TEMRA cells PBMC

Figure: A. Expression of CD45RA vs. CD62L in human CD4+ PBMCs from four donors.  CD4+ TEMRA cells are CD45RA+CD62L (lower right quadrant). B. Expression of CD45RA vs. IFN-gamma in human CD4+ PBMCs from the same four donors stimulated with PMA/ionomycin. CD45RA+IFN-gamma+ cells are likely CD4+ TEMRA cells.

Considering CD4+ TEMRA cells are not only commonly present but highly functional, I wondered if they would be present in the population of “naïve” CD4+ T cells obtained following isolation from PBMC.  If fluorescence-activated cell sorting (FACS) is used for cell isolation, then this is an easier issue to avoid as all of the necessary markers used to differentiate naïve CD4+ T cells from other cell subsets can be included in the marker staining panel.  However, many researchers use commercially available magnetic bead-based kits or other similar methodologies to obtain a “naïve” CD4+ T cell population.  Because there is no single marker that would isolate a naïve CD4 T cell from PBMC, negative selection kits for untouched isolation of naïve CD4+ T cells are commercially available as “one-step” kits.  These are available from companies including Miltenyi Biotec, Stem Cell Technologies, and R&D Systems.

Analysis of the antigens negatively selected for by these kits revealed the following lists: Miltenyi Biotec: CD45RO, CD8, CD14, CD15, CD16, CD19, CD25, CD34, CD36, CD56, CD123, TCRγ/δ, HLA-DR, and CD235a (glycophorin A).

Stem Cell Technologies: CD45RO, CD8, CD14, CD16, CD19, CD20, CD36, CD56, CD66b, CD123, TCRγ/δ, and CD235a (glycophorin A).

Unfortunately, nothing in the literature indicated that any of these markers targeted removal of TEMRA cells, and the manufacturer’s data sheets only show that the final product obtained by using these kits are CD4+CD45RA+ cells.  Technical support from both Miltenyi Biotec and Stem Cell Technologies came to the same conclusion: the CD4+ TEMRA cells are not removed.

The conclusion:  Isolation of naïve CD4 cells without TEMRA cells may still be possible if this is necessary for your assays.  Following usage of one of the above mentioned kits, positive selection for CCR7, CD62L, CD27, or CD28 can be tested.

The final question is whether these cells can affect the experimental results from for instance, studies on T-helper (TH) subset differentiation.  While it is unknown if these cells themselves could differentiate into TH subtypes, they certainly can produce IFN-gamma in culture which inhibits TH subset differentiation along non-TH1 lineages, underscoring the necessity for the inclusion of anti-IFN-gamma antibodies when differentiating TH subtypes other than TH1.

Further reading:

eBiosciences Human CD & Other Cellular Antigens Chart

**Phenotypic heterogeneity of antigen-specific CD4 T cells under different conditions of antigen persistence and antigen load.  Harari A, Vallelian F, Pantaleo G. Eur J Immunol. 2004 Dec;34(12):3525-33.

Phenotype and function of human T lymphocyte subsets: consensus and issues.  Appay V, van Lier RA, Sallusto F, Roederer M. Cytometry A. 2008 Nov;73(11):975-83. doi: 10.1002/cyto.a.20643.

Phenotypic and functional profiling of CD4 T cell compartment in distinct populations of healthy adults with different antigenic exposure.  Roetynck S, Olotu A, Simam J, Marsh K, Stockinger B, Urban B, Langhorne J. PLoS One. 2013;8(1):e55195. doi: 10.1371/journal.pone.0055195. Epub 2013 Jan 28.

Sensitive gene expression profiling of human T cell subsets reveals parallel post-thymic differentiation for CD4+ and CD8+ lineages. Appay V, Bosio A, Lokan S, Wiencek Y, Biervert C, Küsters D, Devevre E, Speiser D, Romero P, Rufer N, Leyvraz S. J Immunol. 2007 Dec 1;179(11):7406-14.

Characterization of CD4(+) CTLs ex vivo.  Appay V, Zaunders JJ, Papagno L, Sutton J, Jaramillo A, Waters A, Easterbrook P, Grey P, Smith D, McMichael AJ, Cooper DA, Rowland-Jones SL, Kelleher AD. J Immunol. 2002 Jun 1;168(11):5954-8.

Altered proportions of naïve, central memory and terminally differentiated central memory subsets among CD4+ and CD8 + T cells expressing CD26 in patients with type 1 diabetes.  Matteucci E, Ghimenti M, Di Beo S, Giampietro O. J Clin Immunol. 2011 Dec;31(6):977-84. doi: 10.1007/s10875-011-9573-z. Epub 2011 Sep 2.

Current Options for Isolating Pure Cell Populations

Antibody based isolation kits for isolating immune cell populations have become a standard protocol in the toolbox of every immunologist over the last two decades. In fact, many new scientists are shocked to learn that lymphocytes used to be isolated from PBMCs and other tissue sources by filtering through nylon wool. How archaic! Here I will describe the various options cell isolation technologies available to biologists today.

FACS: Fluorescence Activated Cell Sorting

FACS is the most sophisticated way of isolating various cells of interest from your tissue source. You have the ability to incorporate up to 10 or so different fluorescent antibodies into your stain, which allows you to sort on cells of interest with exquisite precision and specificity. Another powerful tool is the ability of many FACS machines to do four-way sorts or even single-cell sorts.

However, sorting can be relatively time consuming, depending on your sample size and the percentage of cells of interest. Use of FACS machines are also fairly expensive, whether it be your laboratory’s investment in acquiring its own machine and committing to its maintenance or the hourly rates your institution’s core will charge you (averaging around $100 per hour in my experience).

Magnetic Antibody Based Cell Isolation

Cell separation reagents are available from the three main players in the cell isolation kit world: Stem Cell Technologies, Miltenyi Biotec MACS Technology, and Life Technologies Dynabeads. Though the technology varies slightly from company to company, they basically boil down to the same principles. Usually an antibody cocktail will bind either your cell of interest (positive selection) or your cells of non-interest (negative selection). After a short incubation the addition of magnetic nanoparticle beads to your cell mixture then binds the antibodies from the previous incubation. After another short incubation, cells can then be placed into the magnet purchased from the company. After a few minutes, the antibody bound cells will be drawn towards the magnet and the unbound cells can be collected. Bound cells can then be washed out and collected separately. This technology allows rapid and easy isolation of cell populations from bulk populations.

However, magnetic antibody based cell isolation involves some upfront investment in the purchasing of magnets (approaching $1000) and antibody kits (ranging from $300-$700). Because of this it is important to fully research which companies’ technology is right for you. I also highly recommend sampling the technology on some extra PBMCs you have if at all possible and finding an experienced colleague that can advise when you have questions.

RosetteSep Whole Blood Based Cell Isolation

RosetteSep kits from Stem Cell Technologies allow researchers to quickly isolate cells of interest directly from whole blood and without the investment in magnets. Furthermore it combines the Ficoll gradient isolation step with the isolation of specific target cells, making for an efficient and economical protocol. Instead of using magnetic nanoparticles, RosetteSep uses antibodies that conjugate directly to the RBCs in whole blood. When the blood is Ficolled the RBCs go to the bottom layer along with all the cells that you have targeted with antibody. Your top layer is left with untouched cells of your interest! Of course this protocol only works from whole blood, so it will not work on PBMCs or cells from other tissue sources.

Keep in mind that both FACS and antibody based cell isolation require starting with a single cell suspension of cells. It is important to think about whether you want touched or untouched cells (positive or negative selection) for your downstream assays. I also highly recommend doing purity checks (see figure below) by flow cytometry as often as you can, especially when first adapting any isolation technology to your lab.

Stemm Cell CD14 iso resized 600

 These powerful techniques allow for biologists to isolate a host of cells, including T cells, B cells,  Monocytes, Stem Cells, and many more. In an upcoming post I will go into even further detail and how to choose the right technology for you, including some of the tips and tricks I have learned in my own experience

Further Reading:

Stem Cell Technologies: http://www.stemcell.com/en/Products/Product-Type/Cell-isolation-products.aspx

Life Technologies Dynabeads: http://www.invitrogen.com/site/us/en/home/brands/Product-Brand/Dynal/Dynabeads-Types-and-Uses.html

Miltenyi Biotec MACS Technology: https://www.miltenyibiotec.com/en/Products-and-Services/MACS-Cell-Separation.aspx

RosetteSep: http://www.stemcell.com/en/Products/Popular-Product-Lines/RosetteSep.aspx

A New Subset of Negative Regulatory CD8 T Cells in Human PBMC


T cells
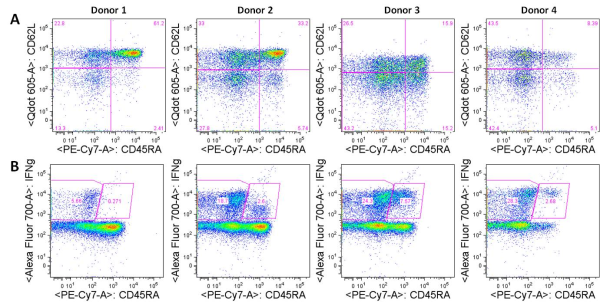
Negative regulatory CD4 T cells
are well characterized and highly studied.  However their CD8 counterparts are not well defined, particularly in humans.  Regulatory CD8 T cells suppress activated CD4 T cells and have proposed roles in various human diseases including multiple sclerosis, ovarian carcinoma and infection with HIV, and many subsets have been described using various markers.  In a recent issue of PLoS One, Hu et. al, describe a population of CD3+CD8+CD161CD56+ T cells within human peripheral blood mononuclear cells (PBMC) that exhibit a cytolytic negative regulatory function.

This group previously published a study where they isolated CD8 T cell clones that were able to lyse autologous T cell receptor (TCR) activated CD4 T cells (Hu et al., 2011).  Surface marker characterization of these regulatory CD8 T cell clones by flow cytometry found that they expressed CD56, CD62L and CD95 but not CD16, CD161, CXCR4 and CCR7.

Because CD161 and CD56 are generally co-expressed markers in NK and NKT cells but are not expressed on conventional CD8 T cells, the authors reasoned that these markers (CD161CD56+) in addition to CD3 and CD8 may provide a robust way to distinguish this population of regulatory CD8 T cells from conventional CD8 T cells, NK cells, and NKT cells by flow cytometry.  Thus in the PLoS One study, the author’s objectives included identification and characterization of this subset of regulatory CD8 T cells in normal human PBMC.

A population of CD3+CD8+CD161CD56+ regulatory CD8 T cells were identified in PBMC and compared with conventional CD8 T cells (CD3+CD8+CD161CD56) and NKT cells (CD3+CD8+CD161+CD56+).  On average, regulatory CD8 T cells occurred at a frequency of 3.2% of total CD8 T cells.  Regulatory CD8 T cells resembled terminally differentiated effector CD8 cells by expressing CD45RA, but not CD45RO or CCR7, and had lower levels of CD62L and CD27.  NKT cells in contrast expressed CD45RO.  For a further discussion of expression of CD45RA, CD45RO, CCR7, CD62L, and CD27 by naïve, central memory, effector memory, and terminally differentiated effector T cell populations, I refer you to a previous post.

Expression of these and numerous other markers were examined in resting and activated regulatory CD8 T cells including CD127, CD25, CD28, CD69, CD94, NKG2a, CD8β, and TCRVα24, and the details can be found in the paper.  Additionally, morphological examination of these cells revealed a larger cytoplasm with some granules, and an irregular nucleus, characteristic of activated T cells and NK cells, but not resting conventional CD8 T cells.

Finally the authors demonstrated that activated CD56+ but notCD56, CD8+CD161 T cells could lyse autologous and allogeneic activated CD4 T cell targets, similarly to the regulatory CD8 T cell clones previously described.

Thus, this study describes the identification of a CD161CD56+ CD8 T cell subset capable of negative regulatory function: cytolysis of activated CD4 T cells.  Many questions remain for further exploration of this interesting population of cells.  Multiple other negative regulatory CD8 T cell subsets have been described including FoxP3+ CD8 T cells.  Determining the differences between various regulatory CD8 T cell subsets regarding marker expression and function should be addressed.  Additionally, the CD8 T cell clones previously described by this group expressed IFN-gamma following activation.  As these negative regulatory CD8 T cells also phenotypically resemble terminally differentiated effector CD8 cells, these populations should be directly functionally compared in future studies.

Identification of Cytolytic CD161(-)CD56(+) Regulatory CD8 T Cells in Human Peripheral Blood.  Hu D, Weiner HL, Ritz J. PLoS One. 2013;8(3):e59545. doi: 10.1371/journal.pone.0059545. Epub 2013 Mar 19.

A clonal model for human CD8+ regulatory T cells: unrestricted contact-dependent killing of activated CD4+ T cellsHu D, Liu X, Zeng W, Weiner HL, Ritz J.  Eur J Immunol. 2012 Jan;42(1):69-79. doi: 10.1002/eji.201141618. Epub 2011 Nov 28.

Basic markers of T cell populations in human PBMC