
Measuring proliferation of lymphocytes such as T cells isolated from peripheral blood monuclear cells (PBMC) using carboxyfluorescein diacetate succinimidyl ester (CFSE) is not a foolproof protocol. CFSE can be toxic to cells and non-optimal CFSE labeling conditions can thus hamper proliferation of cells and obscure interpretation of results. An article in Nature Protocols by Quah et al., details CFSE labeling conditions and how to achieve optimal results.
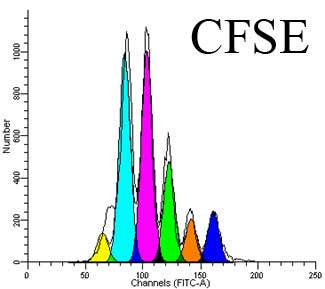
CFSE is a fluorescent cell membrane permeable dye with similar excitation and emission properties as fluorescein isothiocyanate (FITC). Thus CFSE can be assayed in flow cytometry by the same channels that detect the fluorescence intensity of FITC. The CFSE precursor, carboxyfluorescein diacetate succinimidyl ester (CFDA-SE) that is used to label cells is non-fluorescent, but once inside cells, acetate groups are removed by intracellular esterases, causing the resulting CFSE molecule to become fluorescent and also less membrane permeable. Furthermore, the succinimidyl ester group of CFSE covalently couples to primary amine groups, thus remaining bound to proteins inside cells for long time periods. As a cell divides, the intensity of CFSE staining in the resultant daughter cells will be half that of the parent, allowing easy flow cytometric assessment of the number of cell divisions that have occurred since labeling.
While CFSE is commonly used to assess lymphocyte proliferation, CFSE can be toxic and impair cell division. According to Quah et al., four parameters of the labeling conditions must be considered to minimize this toxicity:
1. The concentration of the cells.
2. The concentration of CFSE.
3. The duration of cell labeling.
4. The presence of amino acids in the labeling media.
CFSE will bind to free amines in aqueous conditions and thus reduce the remaining CFSE concentration. To avoid the loss of CFSE to amino acids in the labeling media, PBS is the recommended diluent for CFSE prior to adding to cells. Cells are uniformly suspended in PBS with serum, and the CFSE/PBS stock is immediately mixed rapidly with the cells and allowed to incubate for the optimal amount of time.
Regarding cell and CFSE concentration, these two parameters must be considered in the context of the other. Cells at higher concentrations can be labeled with higher concentrations of CFSE with a minimal effect of CFSE toxicity on cell division. For instance, cells at a concentration of 50 x 106/ml can be labeled with 5uM CFSE, but cells at a concentration of 1 x 10⁶/ml will experience significant toxicity if labeled with 5uM CFSE but will do well with 1uM CFSE. The time of labeling is also important, and longer incubation times will increase toxicity. Quah et al. recommended 5 minutes of incubation with CFSE before washing the cells.
To assess proliferation, after CFSE labeling, cells are washed and then stimulated with a mitogenic signal. For instance, T cells can be stimulated with anti-CD3 + anti-CD28, PHA, SEB, PMA + ionomycin or other stimuli. Then the cells will be allowed to divide for a number of days which must also be optimized depending on the stimulus used.
T cells will die if left unstimulated in vitro and as they proliferate, they can undergo activation induced cell death (AICD). Thus, some amount of cell loss must be anticipated. In an accompanying protocol in Nature Methods, Hawkins et al. detail the incorporation of cell count beads during flow cytometry to more accurately measure the degree of cell proliferation.
Thus, there are many nuances to consider when using CFSE to label cells for assays such as proliferation. I recommend reading both of these protocols to achieve robust assay performance.
Further Reading:
Monitoring lymphocyte proliferation in vitro and in vivo with the intracellular fluorescent dye carboxyfluorescein diacetate succinimidyl ester. Quah BJ, Warren HS, Parish CR. Nat Protoc. 2007;2(9):2049-56.
Measuring lymphocyte proliferation, survival and differentiation using CFSE time-series data. Hawkins ED, Hommel M, Turner ML, Battye FL, Markham JF, Hodgkin PD. Nat Protoc. 2007;2(9):2057-67.
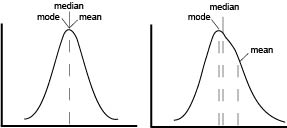
 The first point of confusion is born from the name itself. MFI is often used without explanation, to abbreviate either arithmetic mean, geometric mean, or median fluorescence intensity. In a perfect world, our data would be normally distributed and in that case means, median and mode are all equal. In reality, flow data is rarely normal and never perfect. The more that the data skews, the further the mean drifts in the direction of skew and becomes less representative of the data being analyze as seen on the graphical representation.
 Adam
Adam
