Techniques in Cytology – Cytospin: Cytospin Cell Resuspension Solution

In this blog series opening article, I discussed how cytospins could be used to separate cancer cells from non-cancer cells1. This cytology method and subsequent staining of the resultant cells are a key component of diagnosis and screening of diseases such as cancer. The cytospin technique can be used on any single cell suspensions of any source such as peripheral blood mononuclear cells (PBMCs), effusions, cerebral spinal fluid (CSF), bronchial lavages, fine-needle aspirates, culture cells, etc.

In cytospins, single cell suspensions are spun onto a microscope slide by use of a cytocentrifuge. A cytocentrifuge spins cells at an angle, at low speeds, and accelerates and decelerates gradually. The fluid from the suspension is absorbed onto filter paper while the centrifuge is spinning. This allows the cells to adhere to the slide in a monolayer format. The cell settling rate is determined by the rotational speed of the centrifuge and the size and density of the cells.  Large or dense numbers of cells settle quickly. Small or sparse numbers of cells settle slowly.

One question often asked is what is the optimum resuspension solution for cells that will undergo the cytospin process? The type of resuspension solution used is dependent on the cells.  A good rule of thumb is to use whatever solution will keep the cells alive and healthy throughout the cytospin procedure. The best morphology and subsequent staining of the cytospin cells are generated from cells that are freshly harvested. However, as soon as cells are removed from the body, they begin to die. In order to delay the cell death and protect the cells during the cytospin process, cells are resuspended in tissue culture media or phosphate buffered saline (PBS) with 1% – 10% bovine serum albumin (BSA) and/or 1% – 2% serum such as fetal calf serum (FCS). The tissue culture media and PBS provide a pH balanced liquid and ion replacement for the cell’s native environment. The BSA and serum provide a source of protein as a nutrient to keep the cells healthy and alive for a relatively short amount of time. BSA and serum also stabilizes enzymes to delay internal protein and nucleic acid degradation, which leads to a cascade of events that eventually destroys the cell.

So, should you use tissue culture media or PBS boosted with protein? Again, this depends on the cells and the answer to this question must be determined empirically. If the cells are coming directly from in vitro cell culture then the answer is easy. Keep the cells in the cell culture media that they were culture in. Unless you are interested in seeing on your cytospin slide everything that was in the cell culture well, it is suggested that you wash your cells in fresh media to remove any debris or dead cells before you cytospin. If the cells will be taken directly from the host/patient and then processed for cytospin, determine how long the cells will be out of the host/patient before they are actually taken through the cytospin process. If the cells will be taken through multiple washes to remove debris, other cells, or tissue structural components that are not of interest, it is best to keep the cells resuspended in tissue culture media. A good starting tissue culture media is Dulbecco’s Modified Eagle Medium (DMEM) with 10% FCS. If the cells will be processed immediately or only go through one wash, the cells could be resuspended in PBS with 1% BSA plus 1% FCS as a good starting solution.

My next post will continue with this series on the cytospin process as well as presenting tips for troubleshooting.

1              Ikeda, K., Tate, G., Suzuki, T., Kitamura, T. & Mitsuya, T. Diagnostic usefulness of EMA, IMP3, and GLUT-1 for the immunocytochemical distinction of malignant cells from reactive mesothelial cells in effusion cytology using cytospin preparations. Diagn Cytopathol 39, 395-401, doi:10.1002/dc.21398 (2011).


Techniques in Cytology – Cytospin: Distinguishing Benign Cells from Malignant Cells

Cytology is a key component in diagnosis and screening of diseases such as cancer. It assesses single cells and clusters of cells from sources such as malignant effusions and peripheral blood. Effusions are fluids that leak from blood and lymph vessels and aggregate in tissues and cavities within the body. This is a common problem in cancer patients and can be a reservoir of malignant cells. However, the total number of cells in effusions is small in comparison to the volumes of fluids that are produced. Therefore, in order to collect these cells for evaluation, they must be concentrated.

Cytospin is a cytology method that is specifically designed to concentrate cells such as these that are found in small numbers. After the cytospin is completed, other cytology methods such as immunocytochemistry can be preformed to evaluate the cells. An example is a recent study from Ikeda et al., in which immunocytochemical staining of cytospins from malignant effusions suggested that EMA, IMP3, and GLUT-1 might be helpful in distinguishing malignant cells from benign cells (1). The cytospin process is a simple procedure. Cells are washed in a serum and/or albumin based PBS or culture media solution. The cells are resuspended in up to 500 µl of this solution. A cytofunnel is attached to a glass slide and slide carrier. The entire apparatus is inserted into a cytocentrifuge and the cell suspension is added.

The cells can be spun at various speeds and times depending on the cell type. Eight hundred rpm for up to 5 minutes is a good place to start. The volume to cell ratio must be dilute enough to ensure formation of a monolayer of cells for the best assessment of the cells.

In the Ikeda et al. study, cytology was used to differentiate benign mesothelial cells from malignant mesothelial cells (1). What are mesothelial cells and why is it important to distinguish between benign and malignant forms? These are cells that make up the epithelial lining of the mesothelium which covers the surface of the peritoneal, pericardial, pleural cavities as well as the organs within the cavities (2). The mesothelium has many functions. It is a protective barrier against physical damage and invading organisms as well as being a frictionless interface for free movement of organs and tissue (2). Other functions include roles in fibrinolysis and coagulation, initiation and resolution of inflammation and tissue repair, antigen presentation, transport of fluid and cells, and tumor cell adhesion and growth (2). Reactive mesothelial cells (benign cells) appear in instances when there is a pathogenic infection or physical trauma. Malignant mesothelioma is a rare cancer of mesothelial cells. In effusions, it is sometimes difficult to distinguish benign cells from malignant cells especially when there are few cell numbers. However, immunocytochemistry performed on cytospin cells helps to differentiate these cells. Biomarkers such as epithelial membrane antigen (EMA), glucose transporter-1 (GLUT-1), and insulin-like growth factor-II mRNA-binding protein 3 (IMP3) are useful in separating benign cells from malignant cells. EMA is a large cell surface glycoprotein, also known as MUC1, expressed by glandular and ductal epithelial cells as well as some hematopoietic cells. It has a protective and regulatory role by acting as a barrier to the apical surface of epithelial cells. GLUT-1 is a protein that assists in the transport of glucose across the plasma membrane of cells. It is decreased when glucose levels are high and increased when levels are low. IMP3 binds to sequences in the 3’-UTR of CD44 mRNA. CD44 has a role in cell migration, cell adhesion, and cell-cell interactions. In the Ikeda study, EMA staining intensity on cytospins of malignant mesothelioma cells was strong but staining in reactive cells was weak. EMA stained both the cytoplasm and the membrane of the cells. GLUT-1 stained the membrane of the cytospin cells and expression was highly sensitive in malignant cells. IMP3 stained the cytoplasm of the cytospin cells and expression was lowest in malignant cells. Although these markers help to differentiate malignant from reactive cells, they should not be used as standalone markers. This is because there is no individual biomarker that is exclusively sensitive and specific enough to discriminate between these cells.

Overall, the cytospin technique is a quick method to collect and concentrate fluids that contain a low number of cells. When performing immunocytochemistry after cytospins one can use the same staining protocol used to stain samples from tissue blocks. Cytospins can also be used to take a closer look at cellular staining from cells that have been processed for flow cytometry. This is an excellent method to provide a first look at the immunopathology of a cell. For subsequent postings, the cytospin process will be dissected by discussing key steps and methods of troubleshooting.

Further Reading:

1. Ikeda, K., Tate, G., Suzuki, T., Kitamura, T. & Mitsuya, T. Diagnostic usefulness of EMA, IMP3, and GLUT-1 for the immunocytochemical distinction of malignant cells from reactive mesothelial cells in effusion cytology using cytospin preparations. Diagn Cytopathol 39, 395-401, doi:10.1002/dc.21398 (2011).
2. Mutsaers, S. E. The mesothelial cell. Int J Biochem Cell Biol 36, 9-16 (2004).

Using Mass Spectrometry for Mass T cell Epitope Discovery

Time of Flight Mass Cytometry (CyTOF) is a relatively new multiparametric technology that is far outpacing standard fluorescence-based flow cytometry in the number of parameters that can be simultaneously assessed on a single cell.  In CyTOF, rare transition element isotope-conjugated antibodies are used to label cellular antigens of interest, the magnitude of which is then quantitated by a time of flight mass cytometer, as discussed previously. Previous studies assessing 34 cell surface and intracellular proteins by this technology demonstrated the existence of high dimensional complexity in the heterogeneity of human bone marrow and CD8+ T cell populations.  In a July 2013 article in Nature Biotechonology, Newell et al., move CyTOF and the field of immunology another technological step forward by utilizing CyTOF to measure the frequencies of Rotavirus antigen-specific T cells in human peripheral blood mononuclear cells (PBMCs) and jejunal tissue with peptide-MHC tetramers.

In CyTOF, the theoretical maximum number of simultaneously assessable parameters is 100-200 depending on the instrument.  This vastly outnumbers the assessable parameters of standard fluorescence-based flow cytometry.  To date however, only approximately 40 metal ions have been utilized for antibody labeling, and the development of further metal-chelating technologies is awaited in order to utilize the maximum capacity of the CyTOF instrument.  In the current study, the authors circumvent this limitation by using a “bar-coding” methodology in which a variant combination of three out of ten metal ions are used for labeling each tetramer, allowing for up to 120 different metal combinations.

In this study, the authors sought to identify Rotavirus epitopes recognized by human CD8+ T cells in the context of the MHC class I allele, HLA-A*0201.  To date, only two Rotavirus epitopes recognized by T cells have been identified, and little is known about the phenotypic and functional diversity of antigen-specific T cells for any particular pathogen.  The technical difficulties in proper epitope prediction along with the limited number of cells attainable from human blood samples contribute to these issues.  Thus, this method represents a huge leap forward in the potential to identify significantly more antigen-specific T cell epitopes and to extensively classify these cells functionally.  Using an MHC-prediction algorithm, 77 possible Rotavirus peptides were identified that bound to HLA-A*0201.  An additional 32 positive and negative control tetramers were added for a total of 109 labeled tetramers used to stain each sample simultaneously.  This was further combined with 23-27 metal-chelated antibodies specific for cell surface and intracellular antigens to phenotypically characterize the T cells. A specialized Matlab script was used to analyze the high-dimensional data obtained following mass spectrometry of PBMC and jejunal samples.

On average, CD8 T cell populations specific for two Rotavirus-peptides plus 6-7 peptides from other viruses including influenza, EBV, and CMV, were identified on average across PBMCs from the 17 healthy donors analyzed.  These antigen-specific T cell populations were further phenotypically characterized by expression of surface and intracellular markers.   CD8 T cells specific for six Rotavirus epitopes that included the two previously identified epitopes, were recurrently detected in PBMCs from at least two individuals.  Of these, CD8 cells specific for a Rotavirus peptide from the VP3 protein were most common among healthy donor PBMCs and were phenotypically unique, being of the effector memory subtype compared with a central memory phenotype typical of the T cells specific for the other Rotavirus peptides.  VP3-specific T cells were also uniquely present in jejunal tissue obtained from obese patients that had undergone gastric bypass surgeries.  Thus, this methodology discovered at least 4 new Rotavirus peptides as well as unique characteristics of the different antigen-specific CD8 T cell populations.

In summary, this methodology of combining CyTOF technology with tetramer “bar-coding” paves the way for a vast expansion over fluorescent-based flow cytometry techniques for identifying antigen-specific T cell populations.  As vaccine strategies are an ongoing goal for treatment and prevention of infectious diseases and cancer, it is important to not only identify the peptides that can elicit T cell responses, but also functionally characterize these T cells in order to maximally promote desired immune responses.

Further  Reading:

Combinatorial tetramer staining and mass cytometry analysis facilitate T-cell epitope mapping and characterization.  Newell EW, Sigal N, Nair N, Kidd BA, Greenberg HB, Davis MM. Nat Biotechnol. 2013 Jul;31(7):623-9. doi: 10.1038/nbt.2593. Epub 2013 Jun 9.

Cracking the code of human T-cell immunity.  Harvey CJ, Wucherpfennig KW. Nat Biotechnol. 2013 Jul 9;31(7):609-10. doi: 10.1038/nbt.2626.

Cytometry by time-of-flight shows combinatorial cytokine expression and virus-specific cell niches within a continuum of CD8+ T cell phenotypes. Immunity. 2012 Jan 27;36(1):142-52. doi: 10.1016/j.immuni.2012.01.002.

Single-cell mass cytometry of differential immune and drug responses across a human hematopoietic continuum.  Bendall SC, Simonds EF, Qiu P, Amir el-AD, Krutzik PO, Finck R, Bruggner RV, Melamed R, Trejo A, Ornatsky OI, Balderas RS, Plevritis SK, Sachs K, Pe’er D, Tanner SD, Nolan GP. Science. 2011 May 6;332(6030):687-96. doi: 10.1126/science.1198704.

Whole Blood Phospho-flow: Direct Ex Vivo Measurement of Signaling in PBMC

I previously discussed phospho-flow cytometry, a method to study intracellular protein phosphorylation events in peripheral blood mononuclear cells (PBMC) at the single cell level.  In standard phospho-flow cytometry protocols, prior to performing assays, PBMCs are first isolated from blood using density gradient centrifugation methods such as Ficoll.  However, there may be times when it is advantageous to study signaling pathways in relatively unmanipulated cells directly ex vivo.  For this, Chow et al. have established a protocol for performing phospho-flow cytometry on PBMCs directly in whole blood.

phospho_flow_cytometry

There are many advantages to isolating and cryopreserving PBMCs with the intention of later studying signaling events by methods including standard phospho-flow cytometry.  In particular, when comparisons are desired between patient groups and healthy controls, there is likely to be less confounding contributions of experimental variability to the results if all of the comparative samples are assayed together.  However, as discussed by Chow et al., pharmacodynamic monitoring as well as evaluation of constitutively activated signaling pathways in PBMCs would be best studied on cells having undergone the least manipulation.  Some signaling pathway responses may be more robust in whole blood PBMCs as well.  For example, I have found in my own assays that signaling responses to IL-6 are strongest in whole blood PBMCs compared with PBMCs following Ficoll or culture in the incubator for any amount of time.  This method can also be used to study bone marrow immune cell signaling as well as expression of intracellular molecules that are exposed by the permeabilization method chosen. In addition, looking at signaling events in murine PBMCs is difficult to do if PBMCs need to be isolated first, given the very small amount of blood that can be obtained from a mouse.  In these cases, anti-coagulated whole blood phospho-flow cytometry should be considered.

Whole blood phospho-flow cytometry is a relatively easy method.  Using 100 ul of whole blood is enough for this assay, and the stimulus (cytokine or other activating signaling molecule) is added directly to the whole blood for the preferred amount of time.  PBMCs are then fixed with formaldehyde and a Triton X-100 based buffer is added to lyse the red blood cells and permeabilize the white blood cells.  This is followed with a few washes and finally the cells can be treated with methanol to unmask phospho-epitopes, similarly to the standard phospho-flow cytometry method by Nolan and colleagues.  Chow et al. include an optional step in which the PBMCs can be stored in a freezing buffer prior to methanol treatment.  However, I have successfully stored PBMCs in 90-100% methanol at -20 or -80 ºC until staining for flow cytometry, similarly to what is done for the standard phospho-flow cytometry method by Nolan and colleagues.

As with all protocols involving treatment of cells with reagents such as methanol or Triton X-100, some epitopes may be lost and thus will not be evaluable if staining is done following these treatments.  Thus, there is an alternate method included in the protocol to stain for some antigens up front.  As a reminder however, some fluorophores are sensitive to methanol, for instance V500, and thus cannot be used to stain PBMCs prior to such treatments.  Finally, in a prior article, Chow et al. (2005), tested different methods of fixation, permeabilization and alcohol unmasking, and I have included the link to that article below as an excellent reference in the case that modulation of the protocol is required for optimal assessment of your antigens of interest.

Further Reading:

Whole blood processing for measurement of signaling proteins by flow cytometry.  Chow S, Hedley D, Shankey TV. Curr Protoc Cytom. 2008 Oct;Chapter 9:Unit 9.27.

Whole blood fixation and permeabilization protocol with red blood cell lysis for flow cytometry of intracellular phosphorylated epitopes in leukocyte subpopulations.  Chow S, Hedley D, Grom P, Magari R, Jacobberger JW, Shankey TV. Cytometry A. 2005 Sep;67(1):4-17.

Single-cell phospho-protein analysis by flow cytometry. Schulz KR, Danna EA, Krutzik PO, Nolan GP.Curr Protoc Immunol. 2012 Feb;Chapter 8:Unit 8.17.1-20.


Positive Selection vs Negative Selection for Cell Isolation

In a previous post, I covered the current options for isolating pure cell populations. One immediate question you will have to ask yourself is whether you would prefer positive selection or negative selection (depletion) for the isolation of your cell type of interest.

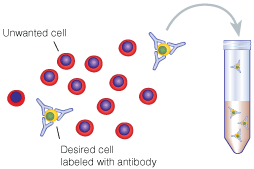
Positive selection involves the isolation of a target cell population by using an antibody that specifically binds that population. As an example, a positive selection kit for T cells would use an antibody specific for the CD3 molecule on T cells. Negative selection, however, involves the depletion of all cell types except your cell type of interest. With our T cell isolation example, our negative selection kit would likely involve antibodies specific for B cells (CD19), monocytes (CD14), NK cells (CD56), and so on. With the depletion of these cell types we would only be left with our cells of interest, in this case T cells (CD3).

The Advantages of Positive Selection

Positive selection and negative selection each havepositiveSelection their advantages. Positive selection offers greater purity due to the specificity of the reaction. You know in our example that positive selection of T cells will only yield a high purity of T cells due to the binding of selection antibodies to CD3 molecules. Negative selection, however, is inherently leakier since it is impossible to design a perfect depletion cocktail to target all cells that do not carry CD3 molecules. It is important to point out though that all of the popular cell isolation companies have made quite excellent kits that yield good purity levels when done properly. The difference in purity between positive selection and negative selection is roughly 99% to 95% pure, both of which are more than serviceable.

Another advantage of positive selection is that it offers the ability for a follow-up selection, or sequential isolations. Since negative selection works by binding all cells except the target cells with bead-bound antibodies, there is no way to do further isolations with the negative population. However, the negative flow through population from positive isolation will not have bead-bound antibodies and therefore is available for either another positive selection or a negative selection of your choice.

The Advantages of Negative Selection

The disadvantage of positive selection of course isnegativeSelection that your isolated cells will carry bead-bound antibodies. Not surprisingly, the kit manufacturers will tell you that this is not a concern, but it is something you need to keep and mind and use at your discretion. While neither the antibodies nor the beads should activate your isolated cells, it may in some way affect your downstream experiments. If you feel this could be an issue and you would prefer ‘untouched’ cells, then negative selection may be the right choice for you. First, however, be sure the negative selection kit actually depletes all necessary cells in order to achieve a pure target population. Often these kits are designed for common target tissues, such as peripheral bloods, lymph nodes, and spleens. Unfortunately negative selection kits may not work well for other target tissues. For example, my own work involves isolation of T cells from tumor samples. Since stock negative selection kits do not contain depletion antibodies for tumor cells, negative selection is not an option for our assays, and as a result we are forced to use positive selection.

It is important to choose an optimal cell isolation strategy specific to your assay, your target cells, and your tissue source. In my next post I will offer some tips for sorting through the various kits and technologies many companies offer for cell isolation.

Optimizing Assays to Find Rare Antigen-Specific T cells in Cryopreserved PBMCs

Immunomonitoring of T cell based immune responses spans a wide range of therapeutic applications such as infectious and autoimmune diseases and is particularly important for vaccine research. Regardless of the therapeutic application, immunomonitoring can be a daunting task due to the variability of methods and protocols available. There are several commonly used functional assays for the enumeration of antigen specific CD8+ T cells and there is great variability in the protocols that are used for these assays. Thus, making it increasing difficult to thoroughly interpret data obtained from multi-center clinical trials and to compare results between laboratories. In order to address some of the issues associated with immunomonitoring of clinical trials, the Association for Immunotherapy of Cancer (CIMT) formed a CIMT monitoring panel tasked to standardize protocols for assaying T cell antigen immune responses. Thirteen centers from 6 different European countries participated in this study. They were given the same samples and asked to determine the number of antigen specific T cells and assess their antigen specific function using tetramer staining and a functional assay of their choice. Common techniques used for monitoring antigen induced immune responses included ELISPOT assays, HLA-multimer staining and intracellular cytokine staining (ICS).

Pre-tested samples of peripheral blood mononuclear cells (PBMC), synthetic peptides, and PE-conjugated HLA-tetramers were distributed to each center. Using HLA-typed healthy volunteers, PBMCs were isolated by Ficoll density gradient separation. Each sample was tested for T cell reactivity against CMV and influenza. All centers received an HLA-A negative control as well as HLA-A positive samples consisting of a combination of CMV and influenza reactive PBMCs. The study comprised of 2 phases; Phase I consisted of all centers performing the assays with their commonly used protocols, and in Phase II each center received optimized protocols based on the findings from Phase I.

For Phase I’s tetramer-staining assay, the laboratories could choose to stain samples with antibodies (Ab) for CD8+ alone, CD3+CD8+, or CD4+ CD8+ and use their preferred Ab clone, fluorescent dye, and Ab concentration. For the functional assays synthetic peptides were provided and each group could choose either the INF-γ ELISPOT assay, FACS-based intracellular INF-γ staining or both with their antigen concentration of choice ranging from 1-10 g/ml. To reduce variability in FACS analysis, sample plots were provided as well as gate settings and quadrants. Tetramer-staining data reported included; number of viable cells post-thawing, cytometer model, number of lymphocytes and/or CD8+ cells analyzed. Data was presented as percent of tetramer-positive cells among CD8+, CD3+CD8+, or CD4+ lymphocytes depending on what antibody cocktail was chosen. For the functional assays each center reported the type of ELISPOT plates used, reagents and conditions used, and number cells tested.

Tetramer results from the Phase I study showed the number CD8+ cells analyzed significantly affected the sensitivity of tetramer staining. Antigen-specific T cell reactivity when less than 30,000 CD8+ T cells were counted resulted in only 70% responsiveness detected. In contrast, when more than 30,000 CD8+ cells were counted, an 89% response was observed. Although, when antigen-specific T cells were present at high frequencies the number of counted cells did not matter. Interestingly, Ab clone variability, Ab concentration, or cytometer type did not result in any significant differences. Thus, the main factors affecting antigen-specific T cell reactivity by tetramer staining is the number of CD8+ cells used. For Phase II it was then recommended at least 1 x10⁶ PBMCs are used for this assay.

The majority of groups chose the INF-γ ELISPOTas their functional assay. Results showed a large amount of heterogeneity between the centers. Some centers included a resting phase after thawing the cells, of 2-20 hours, resulting in 73% positive reactivity (number of spot forming cells per seeded PBMC). In contrast, not allowing a resting phase resulted in only detecting 30% of the positive cells. Additionally, intra-center replicate reproducibility was significantly affected by the number of replicates used, where duplicates often failed the Student t test and triplicates were sufficient to reach statistical significance. Addition of allogenic-APCs for binging and presentation of the synthetic peptides was found to have a negative effect on detection response (28% of all responses vs. 58%). When looking at the number of cells seeded per well, those with more than 4 x10⁵ PBMC detected 71% positive samples and those with less than 4 x10⁵ only detected 43%. Granted, when antigen specific T cells were available at high frequencies the number of counted cells did not affect the response rates. Consequently, Phase II’s minimum requirements for the INF-γ ELISPOT protocol included: (1) triplicates should be performed for each test antigen (2) avoid using allogenic-APCs (3) include a resting phase (4) use over 4 x 10⁵ PBMCs per well.

Another interesting finding from this study was that lab experience in performing these assays had no effect on the performance of the assays compared to labs that had just adopted the techniques. Further highlighting the importance of developing standardized protocols for immunomonitoring assays. This study did not however, address specific detection limits for the ELISPOT assays, the variability between ELISPOT plate readers, nor serum source effects on background and specificity. In addition, it was not reported whether live/dead cell stains where included in the tetramer assays and how combinations of these may have had an effect on the sensitivity of the assay.

Overall, this study identified several factors that should be generally implemented when performing tetramer staining and INF-γ ELISPOT assays with cryopreserved PBMC samples. Furthermore, these protocol modifications are particularly important when assaying antigen-specific T cell populations present at low frequencies.

Reference:

The CIMT-monitoring panel: a two-step approach to harmonize the enumeration of antigen-specific CD8+ T lymphocytes by structural and functional assays. Britten CM, Gouttefangeas C, Welters MJ, Pawelec G, Koch S, Ottensmeier C, Mander A, Walter S, Paschen A, Müller-Berghaus J, Haas I, Mackensen A, Køllgaard T, thor Straten P, Schmitt M, Giannopoulos K, Maier R, Veelken H, Bertinetti C, Konur A, Huber C, Stevanović S, Wölfel T, van der Burg SH. Cancer Immunol Immunother. 2008 Mar;57(3):289-302. Epub 2007 Aug 25.

Highlight: How TNF knocks out Tregs!

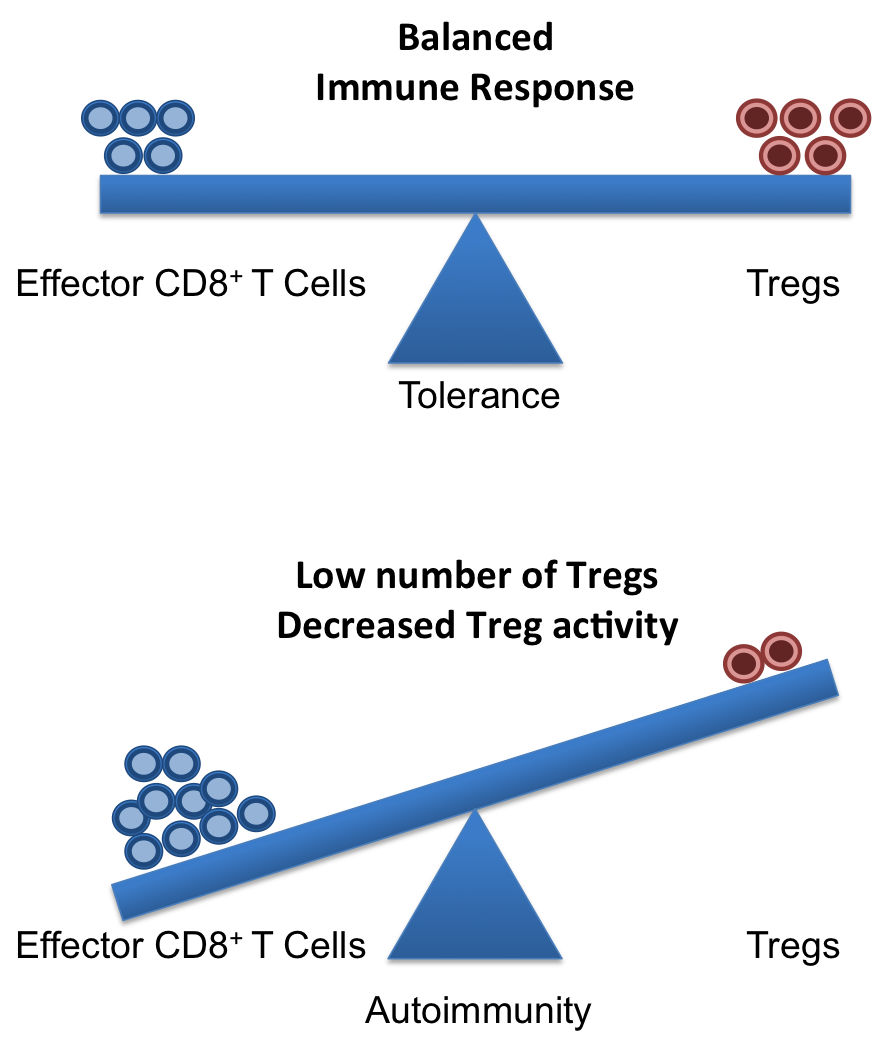
A healthy and functional immune system requires a delicate balance of pro- and contra-inflammatory signals. Whereas, it is important to induce a strong and efficient immune response against pathogens, it is similarly important to dampen these responses after the pathogen is fought off to revert the immune system to a calm steady state. If the balance is disturbed, diseases can on the one hand, become chronic/overwhelming or, on the other hand, inflammatory responses that cannot terminate can result in autoimmune responses.

Crucial elements in the regulation of excessive immune responses are regulatory T (Treg) cells. Tregs are known to inhibit the response of other immune cells. Their essential role in limiting overwhelming immune responses is demonstrated by the detrimental consequences of their loss. Mice or humans lacking Tregs develop widespread and lethal autoimmune diseases. Besides several surface markers, Tregs are best characterized by the expression of the transcription factor FoxP3. This factor is essential for Treg function and its artificial expression in other T cells can induce a regulatory potential. Therefore, the expression of FoxP3 is required for a T cell to have regulatory potential (Buckner; Josefowicz et al.). However, it was known for many years that in cases of numerous autoimmune diseases FoxP3+ Tregs could be found in high numbers at the sides of inflammation, but that they did not demonstrate any or not sufficient regulatory activity. This enigmatic observation was so far poorly understood (Buckner; Josefowicz et al.).Treg balance

In the March 2013 issue of Nature Medicine Nie and colleagues shed new light on the underlying mechanism that impairs Treg function at the sites of inflammation. Studying Treg cells from rheumatoid arthritis (RA) patients the authors demonstrated that phosphorylation of FoxP3 of the serine at position 418 (S418) is required for its regulatory action. If FoxP3 lacks this particular phosphorylation the Treg cell is not suppressive! FoxP3 S418 in Tregs is usually phosphorylated and hence Tregs are regulatory by default. However, the authors show that due to the action of the enzyme ‘protein phosphatase 1’ (PP1) FoxP3 can lose its S418 phosphorylation. Intriguingly, the presence of the cytokine TNF lead to an up-regulation of PP1 expression in the Tregs in a dose-dependent manner, and this lead to de-phosphorylation of FoxP3 S418. Treg cells expressing a mutant FoxP3 that replaced the serine at position 418 with an alanine retained their suppressive potential even in the presence of TNF, demonstrating the importance of the phosphorylation of S418. With this finding, the authors were able to link the pro-inflammatory milieu (TNF) to a specific effect inside of the Tregs (de-phosphorylation of S418) that lead to the observed loss of the regulatory function of Treg cells. Importantly, the authors were also able to demonstrate the therapeutic potential of this knowledge. They monitored RA patients that underwent treatment with blocking anti-TNF antibodies (infliximab) and found that Tregs from patient PBMCs restored S418 phosphorylation and regained regulatory potential!

This is the second case for a post-transcriptional regulation of FoxP3 that can influence Treg function. Deacetylation of FoxP3 has been linked to impaired Treg function previously (Tao et al.). Additionally, the work of Nie et al. now adds mechanistic information to previous reports on the negative effect of TNF on Tregs (Valencia et al.; Zanin-Zhorov et al.).

Given the ubiquitous role of TNF during inflammation, it is very likely that the mechanism described by Nie et al. applies to many if not all cases of ongoing inflammation where Treg function is impaired. Furthermore, their data on the effects of anti-TNF antibody treatment in RA suggest a similar therapeutic potential in other autoimmune diseases. Surely, this report will ignite further investigation in this direction and will aid the development of better treatments for patients suffering from autoimmune diseases.

References:

Bromberg, J., 2013. TNF-α trips up Treg cells in rheumatoid arthritis. Nat Med, 19(3), pp.269–270.

Buckner, J.H., 2010. Mechanisms of impaired regulation by CD4(+)CD25(+)FOXP3(+) regulatory T cells in human autoimmune diseases. Nat Rev Immunol, 10(12), pp.849–859.

Josefowicz, S.Z., Lu, L.-F. & Rudensky, A.Y., 2012. Regulatory T cells: mechanisms of differentiation and function. Annual Review of Immunology, 30, pp.531–564.

Nie, H. et al., 2013. Phosphorylation of FOXP3 controls regulatory T cell function and is inhibited by TNF-α in rheumatoid arthritis. Nat Med, 19(3), pp.322–328.

Tao, R. et al., 2007. Deacetylase inhibition promotes the generation and function of regulatory T cells. Nature Medicine, 13(11), pp.1299–1307.

Valencia, X. et al., 2006. TNF downmodulates the function of human CD4+CD25hi T-regulatory cells. Blood, 108(1), pp.253–261.

Zanin-Zhorov, A. et al., 2010. Protein kinase C-theta mediates negative feedback on regulatory T cell function. Science, 328(5976), pp.372–376.


Considerations for measuring cytokine levels in serum or plasma

Changes in circulating cytokine and chemokine levels have been associated with many human diseases, and thus understanding the relationships between these changes and disease is an important area of medical research.  Circulating levels of these proteins or other chemistries are measured from plasma or serum collected from peripheral blood draws.  It is important to note that the methods of sampling and storage of plasma or serum are critical for accurate measurements.  Here are some important considerations when planning to measure the levels of cytokines and chemokines in serum or plasma.

Blood collection tubes are available in a choice of factors and should blood tubesbe selected based on the analysis being done, as different anti-coagulants support different chemistries.  Plasma is collected from blood drawn into tubes containing anticoagulants, including sodium or lithium heparin which act to inhibit thrombin from blood clotting, or sodium citrate or EDTA which chelate calcium ions to prevent coagulation.  Serum collection tubes contain clot activators, however this method does not allow collection of peripheral blood mononuclear cells (PBMCs) from the same vial, which means that oftentimes, plasma will be the product of choice to maximize the value of blood drawn in a minimal number of tubes from study participants and healthy donors.

luminex service 2Following collection, plasma or serum should be cryopreserved at -80º C.  Cytokines and chemokine levels can be measured by Enzyme-linked immunosorbent assay (ELISA).  However, this method is time consuming and allows measurement of only one factor at a time.  Luminex, a bead-based multiplex assay, can measure up to 100 cytokines, chemokines, or other soluble proteins at a time. Thus, for a given disease cohort, multitudes of measurements can be made from a single small sample of serum or plasma.  Notably, many cytokines and chemokines exist in very low levels in peripheral blood, thus for each cytokine or chemokine to be measured it is important to determine if the detection range of the assay used is sufficient for the known range of circulating levels of that protein.  Also, levels of these proteins may differ depending on whether they were measured in serum or plasma collected in various anticoagulants, so determinations should be done using the most similar methodologies as comparisons.

A methodology paper by de Jager et. al, discusses several important considerations for analyzing cytokine levels from serum or plasma by Luminex.  In this paper, due to unmeasurably low levels of many cytokines, to allow for more dynamic determinations, whole blood was spiked with recombinant cytokines, or treated with LPS for a time period to upregulate expression of cytokines, prior to plasma collection, cryopreservation, and Luminex assays.

One comparison made was the difference in profiles of 15 cytokines in serum, versus plasma from the same donors collected in sodium heparin, EDTA, or citrate.  Overall, cytokine levels were similar with a few exceptions, including IL-6 having the lowest values in serum compared with plasma, while CXCL8 was significantly higher in serum.  The authors concluded that plasma collected in sodium heparin allowed the best measurements overall for the cytokines assessed.  The time it takes to process and store samples after blood collection may also influence cytokine levels and should be done as consistently as possible for the most robust comparisons.

Another hugely important factor is sample storage time.  As with all assays, experimental variation should be minimized, and thus it is common to store plasma or serum samples until the entire cohort has been collected and then analyze all of the samples simultaneously.  This also comes into play when changes in cytokine profiles over time are to be measured from serial samples from an individual. The authors measured cytokine levels from sodium heparin plasma stored at -80º C over time, for up to four years.  Several cytokines including IL-13, IL-15, IL-17 and CXCL8 began to be degraded within one year of storage, while levels of IL-1α, IL-1β, IL-5, IL-6, and IL-10 were degraded by over 50% in 2-3 yearsIL-2, IL-4, IL-12 and IL-18 were much more stable, maintaining their initial levels out to 3 years post initial storage.  Thus, depending on the cytokines being analyzed it is critical to keep these issues in mind.  These are the same issues that are faced with storage of recombinant proteins that are used to generate the ELISA or Luminex standard curves or in other cytokine assays.

Stability of cytokines following several rounds of freeze-thawing were also assessed.  Almost all of the cytokines analyzed with the exception of IL-6 and IL-10 were affected by freeze thawing the samples.  Thus, when storing plasma or serum samples, it is important to freeze the samples in multiple aliquots such that additional assays can be performed while avoiding this issue.

In conclusion, handling and storage of serum and plasma samples as well as the choice of serum versus plasma collected in different anti-coagulants are all important factors to consider when planning for studies that will include measurement of circulating cytokines and chemokines.

Further Reading:

Prerequisites for cytokine measurements in clinical trials with multiplex immunoassays.  de Jager W, Bourcier K, Rijkers GT, Prakken BJ, Seyfert-Margolis V. BMC Immunol. 2009 Sep 28;10:52. doi: 10.1186/1471-2172-10-52.


Using Application Settings to Standardize Flow Cytometry Results Across Experiments and Instruments

While many fluorescence-based flow flow cytometrycytometry assays can be run without concern for hitting the exact same fluorescence intensity target values across different experiments, there are assays that require standardization such that assays run on different days, or even different flow cytometers will render results that can be directly compared.  BD Biosciences has developed a protocol for enabling “Application Settings” on machines running the FACSDiva V6 software, to create settings that allow for standardized consistent fluorescence intensity target values to be obtained across experiments run on different days or instruments.

The ability to collect replicable fluorescence intensity values across assays is invaluable when assays require directly comparable results.  This can easily be envisioned for use in the clinical setting where specifically defined expression levels of a given marker may be used for prognostic or diagnostic indications or therapeutic responses.  Other examples include assays where the number of samples is too large for an experiment to be logically performed on a single day, or time series experiments where samples will be assayed for the same parameters and assessed for their changes over time.

Creating an optimized Application Settings for a given antibody staining panel requires several steps and the understanding of several principles of flow cytometry, and a thorough reading of the protocol referenced at the end of the article is recommended.  Here I will discuss the basics for generating Application Settings and using them on the same cytometer.  For a more detailed explanation of the procedure and how to apply this to additional instruments which have the exact same laser and detector configurations, please refer to BD’s protocol.

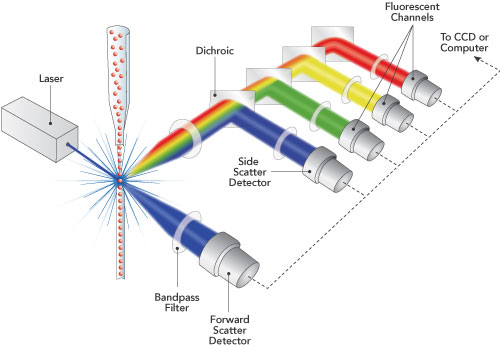
In the first step of this protocol, the user runs the standard Cytometer Setup and Tracking (CS&T) software using the CS&T beads.  This will determine the optimized photomultiplier (PMT) detector voltages for the CS&T beads to minimize electronic noise while maintaining the brightest fluorescence staining in the linear range of the detector.  However, these voltages are optimized for these beads and not for cells.  Thus, once the CS&T report is generated, the next step is to optimize the settings for the cells and stains of interest.

In the next step of this protocol, the objective is to adjust the voltage settings to optimize the balance between the electronic noise and the linear range for each detector using the same cells and fluorescent antibody stains for which the application settings are being created.  The negatively stained cell populations are desired to be located above the noise on the low end, and the positively stained cell populations need to be within the linear range of the measurement.

The electronic noise robust standard deviation (rSDEN) is determined by the CS&T software and indicated in the CS&T report for each detector.  To determine the optimal location between the noise and background for the negatively stained cell populations, a calculation of 2.5 x rSDEN is made for each detector.  Then the voltages are adjusted while running the negatively stained cells to place them at this median fluorescence intensity (MFI) value for every detector being used.

After adjusting for all of the negative populations, the positively stained cells must be assessed to ensure that the cells are still within the detector’s linear range.  The CS&T report also generates a linearity max channel value for each detector.  Thus, the MFI of the positively stained population should be below this value, and allow for any anticipated increases in expression to remain below this value.  Remaining within the linear range is more important than having the negative populations at the 2.5 x rSDEN levels.  Thus, when there is very bright staining, this is important to keep in mind and the voltage should be lowered accordingly.

Finally, after the user has adjusted the voltages to the optimal settings for each detector, the application settings can be saved using the FACSDiva V6 software under: Cytometer Settings -> Application Settings -> Save.

Once the application settings have been created, they can be applied in any future experiments.  To use them, following daily CS&T cytometer setup and performance checks, open a new experiment.  Apply the Use CS&T Settings selection.  Then open the application settings under: Cytometer Settings -> Application Settings -> Apply.  Now consistent MFIs should be obtained for cells run on different experimental days.  One final note is that additional considerations need to be taken if the baseline target values change over time, or a new lot of CS&T beads is used for the daily cytometer setup.  The BD protocol discusses what to do in these instances.

Protocol:

Standardizing Application Setup Across Multiple Flow Cytometers Using BD FACSDiva™ Version 6 Software.  Ellen Meinelt, Mervi Reunanen, Mark Edinger, Maria Jaimes, Alan Stall, Dennis Sasaki, Joe Trotter.

The nuances of using CFSE to monitor lymphocyte proliferation

Measuring proliferation of lymphocytes such as T cells isolated from peripheral blood monuclear cells (PBMC) using carboxyfluorescein diacetate succinimidyl ester (CFSE) is not a foolproof protocol.  CFSE can be toxic to cells and non-optimal CFSE labeling conditions can thus hamper proliferation of cells and obscure interpretation of results.  An article in Nature Protocols by Quah et al., details CFSE labeling conditions and how to achieve optimal results.

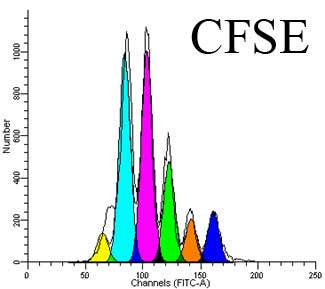
CFSE is a fluorescent cell membrane permeable dye with similar excitation and emission properties as fluorescein isothiocyanate (FITC).  Thus CFSE can be assayed in flow cytometry by the same channels that detect the fluorescence intensity of FITC.  The CFSE precursor, carboxyfluorescein diacetate succinimidyl ester (CFDA-SE) that is used to label cells is non-fluorescent, but once inside cells, acetate groups are removed by intracellular esterases, causing the resulting CFSE molecule to become fluorescent and also less membrane permeable.  Furthermore, the succinimidyl ester group of CFSE covalently couples to primary amine groups, thus remaining bound to proteins inside cells for long time periods.  As a cell divides, the intensity of CFSE staining in the resultant daughter cells will be half that of the parent, allowing easy flow cytometric assessment of the number of cell divisions that have occurred since labeling.

While CFSE is commonly used to assess lymphocyte proliferation, CFSE can be toxic and impair cell division.  According to Quah et al., four parameters of the labeling conditions must be considered to minimize this toxicity:

1. The concentration of the cells.

2. The concentration of CFSE.

3. The duration of cell labeling.

4. The presence of amino acids in the labeling media.

CFSE will bind to free amines in aqueous conditions and thus reduce the remaining CFSE concentration. To avoid the loss of CFSE to amino acids in the labeling media, PBS is the recommended diluent for CFSE prior to adding to cells.  Cells are uniformly suspended in PBS with serum, and the CFSE/PBS stock is immediately mixed rapidly with the cells and allowed to incubate for the optimal amount of time.

Regarding cell and CFSE concentration, these two parameters must be considered in the context of the other.  Cells at higher concentrations can be labeled with higher concentrations of CFSE with a minimal effect of CFSE toxicity on cell division.  For instance, cells at a concentration of 50 x 106/ml can be labeled with 5uM CFSE, but cells at a concentration of 1 x 10⁶/ml will experience significant toxicity if labeled with 5uM CFSE but will do well with 1uM CFSE.  The time of labeling is also important, and longer incubation times will increase toxicity.  Quah et al. recommended 5 minutes of incubation with CFSE before washing the cells.

To assess proliferation, after CFSE labeling, cells are washed and then stimulated with a mitogenic signal.  For instance, T cells can be stimulated with anti-CD3 + anti-CD28, PHA, SEB, PMA + ionomycin or other stimuli.  Then the cells will be allowed to divide for a number of days which must also be optimized depending on the stimulus used.

T cells will die if left unstimulated in vitro and as they proliferate, they can undergo activation induced cell death (AICD).  Thus, some amount of cell loss must be anticipated.  In an accompanying protocol in Nature Methods, Hawkins et al. detail the incorporation of cell count beads during flow cytometry to more accurately measure the degree of cell proliferation.

Thus, there are many nuances to consider when using CFSE to label cells for assays such as proliferation.  I recommend reading both of these protocols to achieve robust assay performance.

Further Reading:

Monitoring lymphocyte proliferation in vitro and in vivo with the intracellular fluorescent dye carboxyfluorescein diacetate succinimidyl ester.  Quah BJ, Warren HS, Parish CR. Nat Protoc. 2007;2(9):2049-56.

Measuring lymphocyte proliferation, survival and differentiation using CFSE time-series data.  Hawkins ED, Hommel M, Turner ML, Battye FL, Markham JF, Hodgkin PD. Nat Protoc. 2007;2(9):2057-67.