Antigen Cross-Presentation by Human Dendritic Cell Subsets

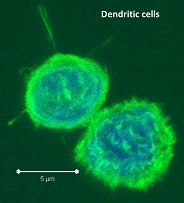
Dendritic cells (DC) are major antigen-presenting cells consisting of numerous heterogeneous subtypes.   In humans, several subtypes of DCs have been identified in different tissues including peripheral blood, secondary lymphoid organs, and in the skin.  In peripheral blood mononuclear cells (PBMC) and secondary lymphoid organs, these subtypes include BDCA1+, BDCA3+, and plasmacytoid DCs which differ functionally and in expression of various markers. So how do these many human DC subsets differ functionally?

Antigen crossdescribe the image-presentation is a DC-specialized mechanism by which antigens are taken up through endocytic and phagocytic pathways but presented in the context of MHC-class I, to activate antigen-specific cytotoxic CD8 T cells.  Recent studies have sought to characterize the differences between the many tissue-associated DC subsets including their ability to cross-present antigen.

In PBMC, DCs are quite rare, comprising only 1 – 2% of PBMCs.  In previous blog posts, the generation of dendritic cells from PBMC monocytes and maturing and assaying monocyte-derived dendritic cells have been discussed.  However, blood DCs and in vitro generated DCs may not represent the true physiological state of DCs present in secondary lymphoid organs where natural antigen cross-presentation and T cell activation occur in vivo.

In a recent study in The Journal of Experimental Medicine, Segura et. al explored the antigen cross-presentation versus phagocytic capabilities of human BDCA1+, BDCA3+, and plasmacytoid DC subsets compared with CD11c+HLADR+CD14+ macrophages that were all freshly isolated from healthy donor tonsils.  The cross-presentation capabilities of different types of antigens, including necrotic dead cell antigens and soluble antigens were assessed.

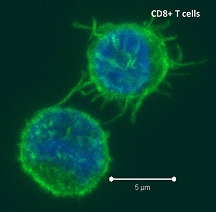
For necrotic dead cell antigens, such as dead tumor cells, BDCA1+ and BDCA3+ DC subsets both took up antigens to a similar extent and were the most efficient in activating CD8+ T cell responses which were measured by IFN-gamma production in allogeneic mixed leukocyte reaction assays.  Macrophages far exceeded the ability of any DC subsets in dead cell phagocytosis, but were extremely poor at cross-presentation and CD8+ T cell activation.  Plasmacytoid DCs were the poorest at phagocytosis of dead cells, and were also unable to cross-present these antigens.  For soluble antigens however, all three DC subsets (BDCA1+, BDCA3+, and plasmacytoid DC) efficiently cross-presented both shorter and longer soluble peptides, while macrophages continued to be poor at cross-presentation.

In an additional set of assays, the authors explored mechanisms that may contribute to the differential phagocytosis versus antigen cross-presentation of DC subsets and macrophages.    Compared with macrophages which did not cross-present antigens, the endocytic compartments of cross-presenting DCs kept an alkaline pH and contained reactive oxygen species, and these DCs further were able to export internalized antigens to the cytosol where they can be loaded onto MHC-class I.  Thus, while macrophages are efficient phagocytes, they are unable to process antigens to allow for cross-presentation.

In conclusion, understanding the capabilities of immune cells in different tissues is critical to discovering the full spectrum of cellular functions.  DCs are a major target for vaccinations and immunotherapeutic strategies, and describing and understanding these subsets in vivo will lead to maximized success in immune modulating modalities.

Further Reading:

Similar antigen cross-presentation capacity and phagocytic functions in all freshly isolated human lymphoid organ-resident dendritic cells.  Segura E, Durand M, Amigorena S. J Exp Med. 2013 Apr 8.

Cross-presentation by dendritic cells.  Joffre OP, Segura E, Savina A, Amigorena S.  Nat Rev Immunol. 2012 Jul 13;12(8):557-69. doi: 10.1038/nri3254. Review.

BDCA-2, BDCA-3, and BDCA-4: three markers for distinct subsets of dendritic cells in human peripheral blood. Dzionek, A., A. Fuchs, P. Schmidt, S. Cremer, M. Zysk, S. Miltenyi, D.W. Buck, and J. Schmitz. 2000. J. Immunol. 165:6037–6046.

Characterization of resident and migratory dendritic cells in human lymph nodes.  Segura, E., J. Valladeau-Guilemond, M.H. Donnadieu, X. Sastre-Garau, V. Soumelis, and S. Amigorena. 2012. J. Exp. Med. 209:653– 660.

Gene family clustering identifies functionally associated subsets of human in vivo blood and tonsillar dendritic cells. Lindstedt, M., K. Lundberg, and C.A. Borrebaeck. 2005. J. Immunol. 175:4839–4846.

Functional specializations of human epidermal Langerhans cells and CD14+ dermal dendritic cellsKlechevsky, E., R. Morita, M. Liu, Y. Cao, S. Coquery, L. Thompson- Snipes, F. Briere, D. Chaussabel, G. Zurawski, A.K. Palucka, et al. 2008. Immunity. 29:497–510.

Characterization of dermal dendritic cells obtained from normal human skin reveals phenotypic and functionally distinctive subsets. Nestle, F.O., X.G. Zheng, C.B. Thompson, L.A. Turka, and B.J. Nickoloff. 1993. J. Immunol. 151:6535–6545.

Promising advances in Recurrent GBM treatment

Glioblastoma multiforme (GBM) are malignant brain tumors, classified by the World Health Organization (WHO), as grade IV tumors of neuroepithelial tissue and are the most common and deadly intracranial tumors, accounting for more than 70% of all brain tumors.  The current course of GBM treatment entails surgical resection followed by administration of radiation and chemotherapy.  However, despite this aggressive regimen and their devastating side effects on the patient, there are several obstacles that hinder their effectiveness; surgical resection of the primary tumor leads to injury to the surrounding normal tissue, while chemotherapy and radiotherapy cause toxicity to the healthy tissue in the brain. Furthermore, some anatomical feature unique to the central nervous system (CNS) such as the blood brain barrier (BBB) and the densely packed structure of brain’s parenchyma inhibits effective drug delivery throughout the brain.

GBM,glioma,FDA,brain tumors

Despite improvements in surgical techniques and post-operational delivery of chemotherapeutics and radiation, the prognosis for GBM patients remains dismal, making these lethal tumors virtually incurable. One of the most prominent intrinsic behaviors of GBM is its invasiveness, such that single glioma cells travel a distance from the tumor mass and invade adjacent brain tissue.  Due to the inherent capability for malignant glioma cells to rapidly proliferate and metastasize away from the primary tumor mass, surgical resection of the tumor is almost always followed by tumor recurrence (rGBM) with foci located as close as 1 centimeter from the resection cavity or as far as the opposite hemisphere. Although the history of glioma treatment dates back to the 19th century, the median survival of patients remains less than 14 months post-diagnosis.

Approximately two-third of rGBM patients are incapable of enduring additional surgical resections. Thus, for over 2 decades, Laser interstitial thermal therapy (LITT) has been used for extirpation of several malignant tumors, especially for patients with rGBM. LITT refers to utilization of low-powered thermal energy to locally cytoreduce the tumor tissue through transdermal thermocoagulation. Nonetheless, a number of technical barriers of the LITT device have impeded its widespread efficacy; two of these major barriers include lack of real-time monitoring of the tissue during treatment, as well as the control of the LITT energy (wavelength) output to correspond with the real time status of the brain tissue (healthy vs. tumor).

MRI,GBM,rGBM,brain tumors

In a recent study published in the Journal of Neurosurgery, Andrew Sloan’s group (Monteris® Medical) reported their results from the First-In-Man (FIM) Phase I clinical trial of their NeuroBlate™ Thermal Therapy System (also know as AutoLITT), which consists laser treatment of recurrent/progressive brain tumors in combination with intraoperative magnetic resonance imaging (MRI) technology. This system overcomes some of the major obstacles to LITT; without the use of radiation, it employs high-resolution MRI images of the brain in real time, which allows surgeons to visualize the progress of tumor ablation at all times, thus directing and controlling the laser deposition to increase treatment efficacy and minimizing harm to the surrounding healthy tissue.

The FDA has designated NeuroBlate™ Thermal Therapy System as safe, since no severe clinical toxicity or procedure-related neurological deficits were caused by this system. This Safety Trial was conducted on 10 patients (median age 55) with recurrent or progressive GBM in whom standard radiotherapy with or without chemotherapy had failed. Based on this study, not only NeuroBlate treatment did not cause any adverse side effects in the subjects, but it also resulted in higher response and survival times than expected.

The technological advancements of NeuroBlate™ Thermal Therapy System which allow a minimally-invasive, and possibly safer method of performing resections, not only for GBM, but perhaps also utilized for the future surgical resection of other cancers. Nonetheless, further investigation is needed to optimize NeuroBlate™ Thermal Therapy System in increasing the mean percentage of treated tumor at the intent-to-treat dose, and determine the long-term efficacy of this system compared with traditional surgical resection.

Further Reading:

Results of the NeuroBlate System first-in-humans Phase I clinical trial for recurrent glioblastoma

Efficient generation of iPSCs from human cord blood and peripheral blood

The initial finding that pluripotency could be induced in human somatic cells revolutionized the field of regenerative medicine, since patient-specific stem cells can now be generated to further examine the causes and mechanisms of various human diseases.  Since the discovery of human iPSCs in 2007 1, various studies have focused on improving the reprogramming methods in order to increase the induction efficiency, as well as to further simplify the protocol.  iPSCs are commonly generated from dermal fibroblasts.  However, skin biopsies are required to isolate fibroblast cells, highlighting the necessity to identify an alternative source of cells for reprogramming that would involve less invasive surgical procedures for isolation.

Cord blood cells and peripheral blood mononuclear cells (PMNCs) are attractive sources for the generation of iPSCs due to the low invasiveness of their collection, as well as the abundance of blood banks for potential donors.  iPSCs were first derived from human peripheral blood in 2009 2.  CD34+ cells were mobilized from peripheral blood and subsequently transduced with retroviruses delivering OCT4, SOX2, KLF4, and MYC vectors.   Although the reprogramming was successful, use of retroviral vectors requires genomic integration of transgenes that may increase the risk of tumor formation during clinical applications.  Thus, recent studies have focused on generation of “integration-free” iPSCs.  Yet, development of integration-free methods often means compromising the reprogramming efficiency.  iPSC induction in CD34+ cells using non-integrating episomal plasmids resulted in ~0.03% reprogramming efficiency 3.

hESC H9p40 resized 600 resized 600Recently, in Stem Cells, Yamanaka’s group reported a protocol that increased the efficiency of iPSC induction from CD34+ cord blood and peripheral blood 4.  They previously identified an efficient combination of episomal plasmids for reprogramming of adult fibroblasts, termed the “Y4” combination, consisting of plasmids encoding OCT3/4, SOX2, KLF4, L-MYC, LIN28, and an shRNA for TP53 5.  Transfection of CD34+ cells from human cord blood with the Y4 combination resulted in up to 0.1% reprogramming efficiency across two donors.  iPSC induction efficiency of PMNCs isolated from peripheral blood with the Y4 mixture, on the other hand, was inconsistent across donors.  To further increase the reproducibility of iPSC induction from multiple donors, the authors added a vector encoding EBNA1, which is required for episomal plasmid replication and should thereby increase expression of the episomal plasmids.  Addition of the EBNA1 vector to the Y4 mixture resulted in 0.1% reprogramming efficiency in PMNCs across seven donors.  Both, the CD34+– and PMNC-derived iPSCs were molecularly and functionally identical to hESCs.

In summary, Okita et al identified a new protocol allowing efficient generation of integration-free iPSCs from blood.  Previous studies reported ~0.02%- 0.03% induction efficiency from peripheral blood 2 and isolated CD34+ cells 3.  Here, the authors reported a reprogramming efficiency of ~0.06%, with a maximum of 0.1%.  In addition, the new protocol could induce iPSCsfrom frozen PMNCs as efficiently as from freshly isolated cells.  Thus, with the increasing number of potential donors available at cord blood banks, iPSCs can be now efficiently generated for use in autologous or allogeneic stem cell therapy.


References

1          Takahashi, K. et al. Induction of pluripotent stem cells from adult human fibroblasts by defined factors. Cell 131, 861-872, doi:10.1016/j.cell.2007.11.019 (2007).

2          Loh, Y. H. et al. Generation of induced pluripotent stem cells from human blood. Blood 113, 5476-5479, doi:10.1182/blood-2009-02-204800 (2009).

3          Mack, A. A., Kroboth, S., Rajesh, D. & Wang, W. B. Generation of induced pluripotent stem cells from CD34+ cells across blood drawn from multiple donors with non-integrating episomal vectors. PLoS One 6, e27956, doi:10.1371/journal.pone.0027956 (2011).

4          Okita, K. et al. An efficient nonviral method to generate integration-free human-induced pluripotent stem cells from cord blood and peripheral blood cells. Stem Cells 31, 458-466, doi:10.1002/stem.1293 (2013).

5          Okita, K. et al. A more efficient method to generate integration-free human iPS cells. Nat Methods 8, 409-412, doi:10.1038/nmeth.1591 (2011).

HISTONE METHYLITRANSFERASE EZH2 IN CANCER

Although cancer is considered a disease of genetic defects, various studies have shown that epigenetic changes also play an important role in the onset and progression of cancer. Epigenetic modifications in mammals include DNA methylation and posttranslational histone modifications such as acetylation, methylation, phosphorylation, sumoylation, and ubiquitination. In human tumors, DNA methylation has been the most widely studied epigenetic modification. However, in recent years there has been a significant growth in our knowledge about the involvement of aberrant patterns of histone modifications in cancer development. In the nucleus, 147 base pairs of DNA are wrapped around an octamer of histone (H) proteins (two copies of each of H2A, H2B, H3 and H4) to form nucleosomes, which in turn are compacted further through several levels of higher-order packing (e.g., H1 aids formation of the 30-nm solenoid) to form chromatin. The accessibility of DNA within the nucleosome is in part controlled by the modifications of the histone proteins. Each histone protein in the nucleosome has a long “tail” that extends beyond the nucleosome. This lysine (K) rich amino-terminal “tail” undergoes various posttranslational modifications by acetyl groups, phosphate groups, and methyl groups. Among these various histone modifications specifically two modifications play crucial roles in the epigenetic control of cellular proliferation and differentiation. These include trimethylation of histone H3 lysine 27 (H3K27me3) which is catalyzed by the enhancer of zeste homolog 2 enzyme (EZH2), results in gene transcriptional repression; and methylation of histone H3 lysine 4 (H3H4me) which is catalyzed by the trithorax homolog myeloid-lymphoid leukemia (MLL), resulting in transcriptional activation. Several genes associated with development, stem cell maintenance, and differentiations are targets of H3K27 and H3K4 methylation. EZH2-mediated H3K27 methylation is also involved in X chromosome inactivation (Xi), a process in which one of the two X-chromosomes in the female cell is transcriptionally repressed, to generate transcriptionally inactive heterochromatin. In addition, as a catalytic subunit of epigenetic regulator Polycomb repressive complex 2, EZH2, a histone methyltransferase (an enzyme that transfers methyl groups), not only methylates histones H3 but also interacts with and recruits DNA methyltransferases to methylate CpG regions (C:cytosine, p:phosphpodiester bond, G:guanine) at certain EZH2 target genes and thereby causing transcriptional repression. Studies in cancer have indicated that deregulation of EZH2 contributes to a variety of tumor development and progression including breast, lung, prostate, pancreatic, and ovarian cancers as well as glioma, lymphoma, and sarcoma.

Overexpression of EZH2 was first reported in prostate anEZH2 resized 600
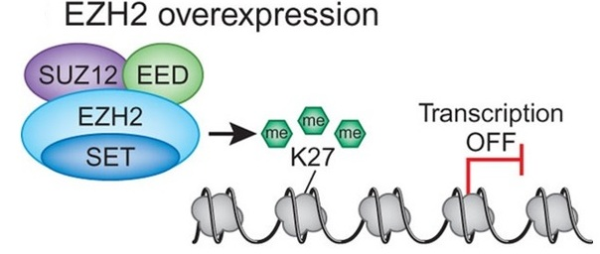
d breast cancer. In both cases increased expression was found to be associated with tumor invasiveness, metastasis, and poor clinical outcome. In addition, elevated expression of EZH2 is also reported in several other tumors including gastric, lung, bladder, and endometrial cancer. Gain of functions as a result of acquired mutations in EZH2 was reported in lymphoma and meyloid neoplasms. The best characterized mechanism by which EZH2 exerts its oncogenic function is by transcriptional repression of genes via its histone methyltransferase activity. Genes which get transcriptionally repressed by EZH2 include tumor suppressor genes ARF, p57KIP2, FBXO32, p27, and BRCA1. In addition, this enzyme also activates transcription of gene CCND1 (cyclin D1) driving cell-cycle progression.
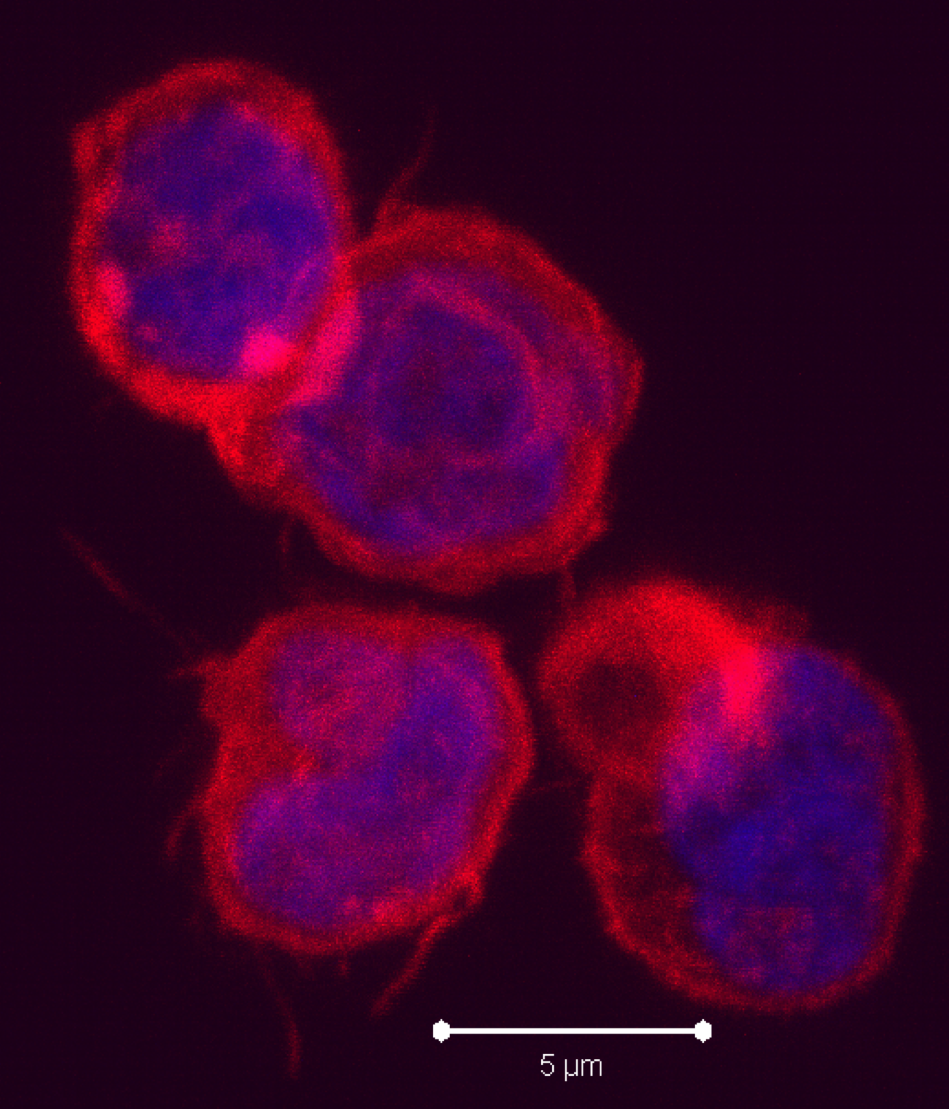
As oncogenic property of EZH2 is mediated through its enzymatic activity, inhibitors of EZH2 are currently under development targeting EZH2’s enzymatic activities. GSK126, a potent, highly selective small-molecule inhibitor of EZH2 methyltransferase activity exhibited promising response in diffuse large B-cell lymphoma (DLBCL) and DLBCL xenografts in mice. However, a recent study by Yan et al. (2013) demonstrated that the oncogenic function of EZH2 may not always be dependent on the enzymatic activities of EZH2. Therefore, therapeutic strategies targeting EZH2 should be designed based on its oncogenic activity via enzymatic properties as well as its function in transcriptional activation of genes involved in various oncogenic pathways.


References:

1.         Ezhkova E, Pasolli HA, Parker JS, et al. Ezh2 orchestrates gene expression for the stepwise differentiation of tissue-specific stem cells. Cell. Vol. 136. United States; 2009:1122-1135.

2.         Ernst T, Chase AJ, Score J, et al. Inactivating mutations of the histone methyltransferase gene EZH2 in myeloid disorders. Nat Genet. Vol. 42. United States; 2010:722-726.

3.         Yan J, Ng SB, Tay JL, et al. EZH2 overexpression in natural killer /T-cell lymphoma confers growth advantage independently of histone methyltransferase activity. Blood. 2013.

Expansion of NK cells from Human PBMC

Natural killer (NK) cells represent up to 15% of human peripheral blood mononuclear cells (PBMC), and range from 5-20% of peripheral blood lymphocytes.  NK cells generally fall into three subtypes: CD56dim CD16+, CD56brightCD16+/- and CD56 CD16+ NK cells, the prevalence and functions of which I have previously discussed.  NK cells are considered to be a promising avenue in cell-based anti-tumor immunotherapeutics.  However, the relatively low numbers of these cell types in PBMC have constituted a technical challenge in these efforts and in other studies needing large numbers of NK cells.  In the April 2013 issue of Clinical & Experimental Immunology, Wang et. al, describe an in vitro method for the preferential expansion of human NK cells from PBMC.

NK cell expansion in vitro systems requires multiple signals for survival, proliferation, and activation.  In a previous study, Fujisaki et. al (200describe the image9) demonstrated that highly cytotoxic CD56+ NK cells could be highly preferentially expanded when cultured with a version of the chronic myeloid leukemia K562 cell line, which was genetically altered to express a membrane-bound form of IL-15 and the 41BB ligand (CD137L).  Under this protocol, NK cells expanded an average of 21.6-fold after 7 days and 277-fold after 21 days in culture, and at 21 days reached a purity of 98.6%.  CD3+ T cells on the other hand fell to an average of 3.1% of the cells remaining after 21 days.  Importantly however, is not only the expansion of NK cells, but the functionality of the expanded cell product.  The NK cells generated by this method had enhanced killing potential in vitro.  In xenograft models of acute myeloid leukemia (AML) in immune deficient NOD/scid-IL2RGnull mice, these NK cells were able to elicit potent anti-leukemic activity.  Thus, this method generates large numbers of highly functional human NK cells.

In the current study by Wang et. al, a similar method was utilized in which the K562 cell line was engineered to express a membrane-bound form of IL-21 along with CD137L.  On average under these conditions, NK cells expanded from less than 30% of PBMC to over 85% after 7 days and 95% after 3 weeks, while CD3+ T cells went from 60% initially to 6% at seven days and 1% at three weeks.  Proliferation of NK cells was continual over eight weeks in culture, and by 3 weeks reached over 100-fold, although the exact numbers and ranges were not explicitly stated in the paper.  Thus, NK cells are highly selectively expanded using this method, similarly to the method used by Fujisaki et. al.

In answer to the functionality of NK cells generated under these conditions, Wang et. al demonstrated enhanced expression of activating and inhibitory NK receptors.  Significantly enhanced cytotoxic killing potential after culture was shown, being maximal after one and three weeks in culture whereafter it decreased but still remained higher than resting NK cells.  Thus, these expanded NK cells are also highly functional.

It would be interesting to see a direct comparison of the extent and quality of NK cell expansion from human PBMC by CD137L combined with the membrane-bound form of IL-15 as was done by Fujisaki et. al versus the membrane-bound form of IL-21 developed by Wang et. al.  IL-21 is a strong and preferential activator of STAT3.  Wang et al did establish a role for STAT3 in the induction of these cells.  IL-15 is a strong activator of STAT5 and activates STAT3 to a lesser extent.  However, IL-15 has been shown to strongly induce expression of the STAT3-activating cytokine IL-10.  Thus, for optimal clinical applications of expanded NK cells, it is important to determine how the different cytokine-STAT signals contribute to NK cell proliferation, survival, and activation.

Further Reading:

Membrane-bound interleukin-21 and CD137 ligand induce functional human natural killer cells from peripheral blood mononuclear cells through STAT-3 activation.  Wang X, Lee DA, Wang Y, Wang L, Yao Y, Lin Z, Cheng J, Zhu S. Clin Exp Immunol. 2013 Apr;172(1):104-12. doi: 10.1111/cei.12034.

Expansion of highly cytotoxic human natural killer cells for cancer cell therapy.  Fujisaki H, Kakuda H, Shimasaki N, Imai C, Ma J, Lockey T, Eldridge P, Leung WH, Campana D. Cancer Res. 2009 May 1;69(9):4010-7. doi: 10.1158/0008-5472.CAN-08-3712. Epub 2009 Apr 21.

Natural Killer Cell subtypes and markers in human PBMC

Types of immune cells present in human PBMC

Prospects for the use of NK cells in immunotherapy of human cancer.  Ljunggren HG, Malmberg KJ. Nat Rev Immunol. 2007 May;7(5):329-39.

Properties of the K562 cell line, derived from a patient with chronic myeloid leukemia.  Klein E, Ben-Bassat H, Neumann H, Ralph P, Zeuthen J, Polliack A, Vánky F. Int J Cancer. 1976 Oct 15;18(4):421-31.

Characterization of cytokine differential induction of STAT complexes in primary human T and NK cells.  Yu CR, Young HA, Ortaldo JR. J Leukoc Biol. 1998 Aug;64(2):245-58.

IL-15-induced IL-10 increases the cytolytic activity of human natural killer cells.  Park JY, Lee SH, Yoon SR, Park YJ, Jung H, Kim TD, Choi I. Mol Cells. 2011 Sep;32(3):265-72. doi: 10.1007/s10059-011-1057-8. Epub 2011 Jul 29.

Are Terminally Differentiated Effector Memory Cells present in those “Naïve” CD4+ T cells you isolated from human PBMC?

Immunologists study many aspects regarding differentiation of T cells and function of T cell lineages.  The results and interpretations from these studies always rely on the robustness of the experimental setup.  A question that I posed to myself recently, when testing protocols for differentiation of naïve CD4+ T cells into various functional lineages (TH1, TH2, TH17, TREG), was whether or not CD4+ terminally differentiated effector memory (TEMRA) cells are still present in the population of “naïve” CD4+ T cells obtained following isolation from peripheral blood mononuclear cells (PBMC).

Following antigen exposure, CD4+ and CD8+ T cells undergo differentiation thorough various stages.  While the exact path of differentiation remains under exploration, a current mainstream hypothesis is that naïve cells (TN) progress through central memory (TCM), then effector memory (TEM), then finally terminally differentiated effector memory (TEMRA) states.  Expression of surface markers have been used to identify human T cells in these various states, including CD45RA, CD45RO, CCR7, CD62L, CD27, and CD28.  After antigen exposure, naïve T cells, which are CD45RA+CD45ROCCR7+CD62L+CD27+CD28+ lose expression of CD45RA and gain expression of CD45RO.  As memory T cells progress from TCM to TEM cells, they additionally lose expression of CCR7, CD45RA+, CD27, and CD28.  Finally, TEMRA cells regain expression of CD45RA, but remain identifiable from naïve T cells by their lack of CCR7, CD62L, CD27, and CD28 expression.

The function of CD4+ TEMRA cells parallels that of CD8+ TEMRA cells.  These cells are cytolytic and express IFN-gamma after activation through their TCR or stimulation with PMA/ionomycin. CD4+ TEMRA cells also have shorter telomeres than naïve, TCM, and TEM populations, and lower homeostatic proliferation capacity.

While TEMRA cells are well described for CD8+ T cells, they often are ignored as part of the CD4+ compartment.  Despite the lack of attention that  CD4+ TEMRA cells are given in the literature, I observe them quite frequently in human PBMC from healthy donors, on average being 4% of CD4+ T cells (range 0-15%) and 11% of CD4+CD45RA+ cells (range 0-40%).  Additionally, the percentage of CD4+ TEMRA cells that I observe has a strong correlation with IFN-gamma production by CD4+CD45RA+ T cells from the same donor.

CD4 naive TEMRA cells PBMC

Figure: A. Expression of CD45RA vs. CD62L in human CD4+ PBMCs from four donors.  CD4+ TEMRA cells are CD45RA+CD62L (lower right quadrant). B. Expression of CD45RA vs. IFN-gamma in human CD4+ PBMCs from the same four donors stimulated with PMA/ionomycin. CD45RA+IFN-gamma+ cells are likely CD4+ TEMRA cells.

Considering CD4+ TEMRA cells are not only commonly present but highly functional, I wondered if they would be present in the population of “naïve” CD4+ T cells obtained following isolation from PBMC.  If fluorescence-activated cell sorting (FACS) is used for cell isolation, then this is an easier issue to avoid as all of the necessary markers used to differentiate naïve CD4+ T cells from other cell subsets can be included in the marker staining panel.  However, many researchers use commercially available magnetic bead-based kits or other similar methodologies to obtain a “naïve” CD4+ T cell population.  Because there is no single marker that would isolate a naïve CD4 T cell from PBMC, negative selection kits for untouched isolation of naïve CD4+ T cells are commercially available as “one-step” kits.  These are available from companies including Miltenyi Biotec, Stem Cell Technologies, and R&D Systems.

Analysis of the antigens negatively selected for by these kits revealed the following lists: Miltenyi Biotec: CD45RO, CD8, CD14, CD15, CD16, CD19, CD25, CD34, CD36, CD56, CD123, TCRγ/δ, HLA-DR, and CD235a (glycophorin A).

Stem Cell Technologies: CD45RO, CD8, CD14, CD16, CD19, CD20, CD36, CD56, CD66b, CD123, TCRγ/δ, and CD235a (glycophorin A).

Unfortunately, nothing in the literature indicated that any of these markers targeted removal of TEMRA cells, and the manufacturer’s data sheets only show that the final product obtained by using these kits are CD4+CD45RA+ cells.  Technical support from both Miltenyi Biotec and Stem Cell Technologies came to the same conclusion: the CD4+ TEMRA cells are not removed.

The conclusion:  Isolation of naïve CD4 cells without TEMRA cells may still be possible if this is necessary for your assays.  Following usage of one of the above mentioned kits, positive selection for CCR7, CD62L, CD27, or CD28 can be tested.

The final question is whether these cells can affect the experimental results from for instance, studies on T-helper (TH) subset differentiation.  While it is unknown if these cells themselves could differentiate into TH subtypes, they certainly can produce IFN-gamma in culture which inhibits TH subset differentiation along non-TH1 lineages, underscoring the necessity for the inclusion of anti-IFN-gamma antibodies when differentiating TH subtypes other than TH1.

Further reading:

eBiosciences Human CD & Other Cellular Antigens Chart

**Phenotypic heterogeneity of antigen-specific CD4 T cells under different conditions of antigen persistence and antigen load.  Harari A, Vallelian F, Pantaleo G. Eur J Immunol. 2004 Dec;34(12):3525-33.

Phenotype and function of human T lymphocyte subsets: consensus and issues.  Appay V, van Lier RA, Sallusto F, Roederer M. Cytometry A. 2008 Nov;73(11):975-83. doi: 10.1002/cyto.a.20643.

Phenotypic and functional profiling of CD4 T cell compartment in distinct populations of healthy adults with different antigenic exposure.  Roetynck S, Olotu A, Simam J, Marsh K, Stockinger B, Urban B, Langhorne J. PLoS One. 2013;8(1):e55195. doi: 10.1371/journal.pone.0055195. Epub 2013 Jan 28.

Sensitive gene expression profiling of human T cell subsets reveals parallel post-thymic differentiation for CD4+ and CD8+ lineages. Appay V, Bosio A, Lokan S, Wiencek Y, Biervert C, Küsters D, Devevre E, Speiser D, Romero P, Rufer N, Leyvraz S. J Immunol. 2007 Dec 1;179(11):7406-14.

Characterization of CD4(+) CTLs ex vivo.  Appay V, Zaunders JJ, Papagno L, Sutton J, Jaramillo A, Waters A, Easterbrook P, Grey P, Smith D, McMichael AJ, Cooper DA, Rowland-Jones SL, Kelleher AD. J Immunol. 2002 Jun 1;168(11):5954-8.

Altered proportions of naïve, central memory and terminally differentiated central memory subsets among CD4+ and CD8 + T cells expressing CD26 in patients with type 1 diabetes.  Matteucci E, Ghimenti M, Di Beo S, Giampietro O. J Clin Immunol. 2011 Dec;31(6):977-84. doi: 10.1007/s10875-011-9573-z. Epub 2011 Sep 2.

Current Options for Isolating Pure Cell Populations

Antibody based isolation kits for isolating immune cell populations have become a standard protocol in the toolbox of every immunologist over the last two decades. In fact, many new scientists are shocked to learn that lymphocytes used to be isolated from PBMCs and other tissue sources by filtering through nylon wool. How archaic! Here I will describe the various options cell isolation technologies available to biologists today.

FACS: Fluorescence Activated Cell Sorting

FACS is the most sophisticated way of isolating various cells of interest from your tissue source. You have the ability to incorporate up to 10 or so different fluorescent antibodies into your stain, which allows you to sort on cells of interest with exquisite precision and specificity. Another powerful tool is the ability of many FACS machines to do four-way sorts or even single-cell sorts.

However, sorting can be relatively time consuming, depending on your sample size and the percentage of cells of interest. Use of FACS machines are also fairly expensive, whether it be your laboratory’s investment in acquiring its own machine and committing to its maintenance or the hourly rates your institution’s core will charge you (averaging around $100 per hour in my experience).

Magnetic Antibody Based Cell Isolation

Cell separation reagents are available from the three main players in the cell isolation kit world: Stem Cell Technologies, Miltenyi Biotec MACS Technology, and Life Technologies Dynabeads. Though the technology varies slightly from company to company, they basically boil down to the same principles. Usually an antibody cocktail will bind either your cell of interest (positive selection) or your cells of non-interest (negative selection). After a short incubation the addition of magnetic nanoparticle beads to your cell mixture then binds the antibodies from the previous incubation. After another short incubation, cells can then be placed into the magnet purchased from the company. After a few minutes, the antibody bound cells will be drawn towards the magnet and the unbound cells can be collected. Bound cells can then be washed out and collected separately. This technology allows rapid and easy isolation of cell populations from bulk populations.

However, magnetic antibody based cell isolation involves some upfront investment in the purchasing of magnets (approaching $1000) and antibody kits (ranging from $300-$700). Because of this it is important to fully research which companies’ technology is right for you. I also highly recommend sampling the technology on some extra PBMCs you have if at all possible and finding an experienced colleague that can advise when you have questions.

RosetteSep Whole Blood Based Cell Isolation

RosetteSep kits from Stem Cell Technologies allow researchers to quickly isolate cells of interest directly from whole blood and without the investment in magnets. Furthermore it combines the Ficoll gradient isolation step with the isolation of specific target cells, making for an efficient and economical protocol. Instead of using magnetic nanoparticles, RosetteSep uses antibodies that conjugate directly to the RBCs in whole blood. When the blood is Ficolled the RBCs go to the bottom layer along with all the cells that you have targeted with antibody. Your top layer is left with untouched cells of your interest! Of course this protocol only works from whole blood, so it will not work on PBMCs or cells from other tissue sources.

Keep in mind that both FACS and antibody based cell isolation require starting with a single cell suspension of cells. It is important to think about whether you want touched or untouched cells (positive or negative selection) for your downstream assays. I also highly recommend doing purity checks (see figure below) by flow cytometry as often as you can, especially when first adapting any isolation technology to your lab.

Stemm Cell CD14 iso resized 600

 These powerful techniques allow for biologists to isolate a host of cells, including T cells, B cells,  Monocytes, Stem Cells, and many more. In an upcoming post I will go into even further detail and how to choose the right technology for you, including some of the tips and tricks I have learned in my own experience

Further Reading:

Stem Cell Technologies: http://www.stemcell.com/en/Products/Product-Type/Cell-isolation-products.aspx

Life Technologies Dynabeads: http://www.invitrogen.com/site/us/en/home/brands/Product-Brand/Dynal/Dynabeads-Types-and-Uses.html

Miltenyi Biotec MACS Technology: https://www.miltenyibiotec.com/en/Products-and-Services/MACS-Cell-Separation.aspx

RosetteSep: http://www.stemcell.com/en/Products/Popular-Product-Lines/RosetteSep.aspx

A New Subset of Negative Regulatory CD8 T Cells in Human PBMC


T cells
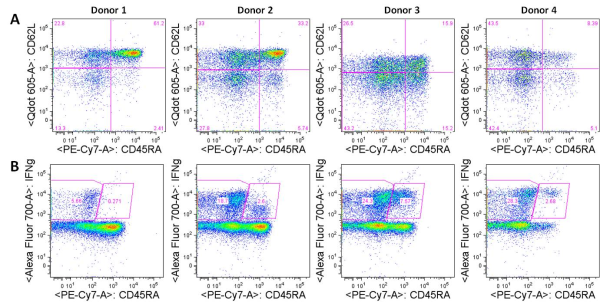
Negative regulatory CD4 T cells
are well characterized and highly studied.  However their CD8 counterparts are not well defined, particularly in humans.  Regulatory CD8 T cells suppress activated CD4 T cells and have proposed roles in various human diseases including multiple sclerosis, ovarian carcinoma and infection with HIV, and many subsets have been described using various markers.  In a recent issue of PLoS One, Hu et. al, describe a population of CD3+CD8+CD161CD56+ T cells within human peripheral blood mononuclear cells (PBMC) that exhibit a cytolytic negative regulatory function.

This group previously published a study where they isolated CD8 T cell clones that were able to lyse autologous T cell receptor (TCR) activated CD4 T cells (Hu et al., 2011).  Surface marker characterization of these regulatory CD8 T cell clones by flow cytometry found that they expressed CD56, CD62L and CD95 but not CD16, CD161, CXCR4 and CCR7.

Because CD161 and CD56 are generally co-expressed markers in NK and NKT cells but are not expressed on conventional CD8 T cells, the authors reasoned that these markers (CD161CD56+) in addition to CD3 and CD8 may provide a robust way to distinguish this population of regulatory CD8 T cells from conventional CD8 T cells, NK cells, and NKT cells by flow cytometry.  Thus in the PLoS One study, the author’s objectives included identification and characterization of this subset of regulatory CD8 T cells in normal human PBMC.

A population of CD3+CD8+CD161CD56+ regulatory CD8 T cells were identified in PBMC and compared with conventional CD8 T cells (CD3+CD8+CD161CD56) and NKT cells (CD3+CD8+CD161+CD56+).  On average, regulatory CD8 T cells occurred at a frequency of 3.2% of total CD8 T cells.  Regulatory CD8 T cells resembled terminally differentiated effector CD8 cells by expressing CD45RA, but not CD45RO or CCR7, and had lower levels of CD62L and CD27.  NKT cells in contrast expressed CD45RO.  For a further discussion of expression of CD45RA, CD45RO, CCR7, CD62L, and CD27 by naïve, central memory, effector memory, and terminally differentiated effector T cell populations, I refer you to a previous post.

Expression of these and numerous other markers were examined in resting and activated regulatory CD8 T cells including CD127, CD25, CD28, CD69, CD94, NKG2a, CD8β, and TCRVα24, and the details can be found in the paper.  Additionally, morphological examination of these cells revealed a larger cytoplasm with some granules, and an irregular nucleus, characteristic of activated T cells and NK cells, but not resting conventional CD8 T cells.

Finally the authors demonstrated that activated CD56+ but notCD56, CD8+CD161 T cells could lyse autologous and allogeneic activated CD4 T cell targets, similarly to the regulatory CD8 T cell clones previously described.

Thus, this study describes the identification of a CD161CD56+ CD8 T cell subset capable of negative regulatory function: cytolysis of activated CD4 T cells.  Many questions remain for further exploration of this interesting population of cells.  Multiple other negative regulatory CD8 T cell subsets have been described including FoxP3+ CD8 T cells.  Determining the differences between various regulatory CD8 T cell subsets regarding marker expression and function should be addressed.  Additionally, the CD8 T cell clones previously described by this group expressed IFN-gamma following activation.  As these negative regulatory CD8 T cells also phenotypically resemble terminally differentiated effector CD8 cells, these populations should be directly functionally compared in future studies.

Identification of Cytolytic CD161(-)CD56(+) Regulatory CD8 T Cells in Human Peripheral Blood.  Hu D, Weiner HL, Ritz J. PLoS One. 2013;8(3):e59545. doi: 10.1371/journal.pone.0059545. Epub 2013 Mar 19.

A clonal model for human CD8+ regulatory T cells: unrestricted contact-dependent killing of activated CD4+ T cellsHu D, Liu X, Zeng W, Weiner HL, Ritz J.  Eur J Immunol. 2012 Jan;42(1):69-79. doi: 10.1002/eji.201141618. Epub 2011 Nov 28.

Basic markers of T cell populations in human PBMC

RESISTANCE TO B-RAF INHIBITORS IN MELANOMA

B-RAF is a serine/therionine protein kinase which activates the mitogen-activated protein kinase (MAPK) signaling pathway. As suggested by Hanahan and Weinberg (2000) six major hallmarks of cancer are: independence of proliferation signals, evasion of apoptosis, insensitivity to anti-growth signals, unlimited replicative potential, the ability to invade and metastasize, and induction of angiogenesis for nutrient supply.  Abnormalities in the MAPK signaling impinge on most, if not all these processes, and play a critical role in the development and progression of cancer. Activating mutations in B-RAF kinase (mostly V600E B-RAF) are observed in about 50% of melanomas resulting in constitutive activation of the MAPK pathway. With the increasing knowledge about the role of V600E B-RAF mutation in melanoma progression, efforts have been made to target and inhibit this kinase and its downstream signaling. The ATP-competitive type I B-RAF inhibitors vemurafenib and dabrafenib (GSK2118436) exhibit remarkable anti-cancer activity in patients with V600E B-RAF mutant melanomas. However, acquisition of drug resistance virtually occurs in all patients treated with B-RAF inhibitors. In clinical trials with the B-RAF inhibitors, disease progression was noted in most of the patients after 6-7 months of initial response. Investigations at the molecular level suggest that development of resistance is associated with the acquisition of the secondary mutations within the kinase ATP binding site that inhibited the binding of drug to the hydrophobic pocket at so-called “gatekeeper” residue. In a preclinical study  Whittaker et al. (2010) reported that a gatekeeper mutation in BRAF  at Threonine-259 (T259) residue conferred resistance to the B-RAF inhibitors SB590885 and PLX4720. However, no such mutation was observed in patients whose disease progressed following vemurafenib treatment. This suggests existence of V600EB-RAF-bypass mechanism for acquired resistance to the B-RAF inhresistance to RAF inhibitors resized 600
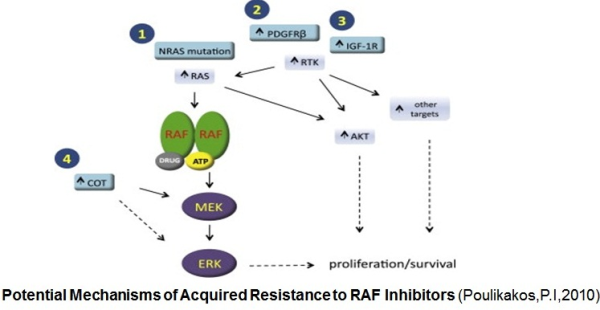
ibitors. Activation of the MAPK signaling and increased expression of C-RAF (an isoform of B-RAF) was noted in melanoma cells resistant to B-RAF inhibitors. In this study Villanueva et al. (2010 ) also observed constitutive activation of the insulin-like growth factor receptor 1 (IFGR1), a receptor tyrosine kinase (RTK) in the resistant cells. As IGFR1 activates PI3K/Akt signaling, combined treatment of PI3K and MEK inhibitors resulted in resistance reversal. Increased levels of IGFR1 was also observed in melanoma patients failing vemurafenib suggesting activation of PI3K/Akt signaling via IGFR1 could limit the efficacy of B-RAF inhibitors in the clinic. Up-regulation of other RTKs was also found to be associated with the acquired resistance to vemurafenib. Tumor biopsies of melanoma patients failing vemurafenib exhibited over-expression of the platelet derived growth factor receptor-β (Nazarian et al., 2010).

In addition to the increase RTKs activity, resistance to the B-RAF inhibitors was noted to be mediated by genetic alteration in the MAPK signaling pathway. Genetic analysis detected an activating mutation in NRAS in codon 61 in tumor biopsies from patients treated with vemurafenib (Nazarian et al., 2010). Next, there is also evidence of B-RAF alterations in tumor samples collected from patients whose cancer progressed after initial response to B-RAF inhibitors. A study by Shi et al. (2012) reported overexpression of V600EB-RAF as a result of genomic copy-numbers gain in 20% vemurafenib resistant melanoma patients. In the in vitro study, Shi et al. observed restoration of the sensitivity of the B-RAF amplification driven vemurafenib resistant cells to vemurafenib following treatment with the MEK inhibitor selumetinib (AZD6244). This observation provides evidence of the MAPK pathway reactivation as a mechanism of resistance. Existence of a structural changes in B-RAF could also confer resistance as identified by Poulikakos et al. (2011). Their study discovered a splice variant of B-RAF(V600E). Expression of a 61-kDa B-RAF variant lacking RAS-binding domain was identified in the tumors of 32% patients with acquired resistance to vemurafenib.

One of the challenges in melanoma treatment is how to develop effective strategies for overcoming intrinsic and acquired drug resistance to small molecule B-RAF inhibitors. Although the resistance mechanisms identified so far are diverse, most seem to rely upon the reactivation of the MAPK signaling pathway and enhanced signaling output through the PI3K/Akt signaling pathway. Therefore, dual BRAF and PI3K/Akt signaling pathway inhibition may prevent or delay the onset of resistance in melanoma.


References:

1.         Hanahan D, Weinberg RA. The hallmarks of cancer. Cell. Vol. 100. United States; 2000:57-70.

2.         Whittaker S, Kirk R, Hayward R, et al. Gatekeeper mutations mediate resistance to BRAF-targeted therapies. Sci Transl Med. Vol. 2. United States; 2010:35ra41.

3.         Villanueva J, Vultur A, Lee JT, et al. Acquired resistance to BRAF inhibitors mediated by a RAF kinase switch in melanoma can be overcome by cotargeting MEK and IGF-1R/PI3K. Cancer Cell. Vol. 18. United States: 2010 Elsevier Inc; 2010:683-695.

4.         Nazarian R, Shi H, Wang Q, et al. Melanomas acquire resistance to B-RAF(V600E) inhibition by RTK or N-RAS upregulation. Nature. Vol. 468. England; 2010:973-977.

5.         Shi H, Moriceau G, Kong X, et al. Melanoma whole-exome sequencing identifies (V600E)B-RAF amplification-mediated acquired B-RAF inhibitor resistance. Nat Commun. Vol. 3. England; 2012:724.

6.         Alas S, Bonavida B. Inhibition of constitutive STAT3 activity sensitizes resistant non-Hodgkin’s lymphoma and multiple myeloma to chemotherapeutic drug-mediated apoptosis. Clin Cancer Res. 2003;9(1):316-326.

Time of Flight Mass Cytometry (Cytof): Flying way beyond Fluorescent flow

flow cytometry
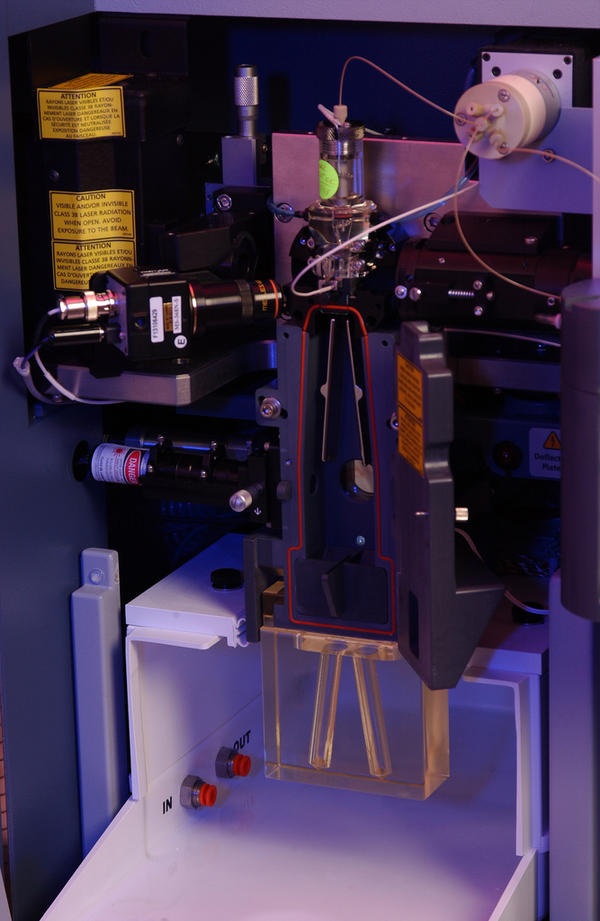
Flow cytometry has been around since the 1950s when Wallace Coulter developed the first flow cytometry device and fluorescence-based flow cytometry was introduced in 1968 by Wolfgang Göhde.  Since then, fluorescence-based flow cytometry and fluorescence-activated cell sorting (FACS) have blown up to become a mainstay of analytical scientific approaches in every field of cell biology, especially immunology.  However, the dominance of fluorescence-based flow cytometry for analytical cellular biology may change with the recent introduction of a new technology: Time of Flight Mass Cytometry (CyTOF).

In fluorescence-based flow cytometry, cells or particles labeled with fluorescent dye-conjugated antibodies or other fluorescent proteins flow in a single file stream past a series of lasers that emit light at specific wavelengths, causing the fluorescent dyes to become excited and emit light caught by detectors.  Thus, a quantitative measure of intensity for each fluorescent parameter, pertaining to the expression level of the antibody-targeted antigen of interest, is obtained for every cell.  The BD Biosciences Influx cell sorter is currently a top of the line fluorescence-based flow cytometer, and supports up to 10 lasers and detection of up to 24 parameters.  However, even with a thorough understanding of flow cytometry, the actual number of utilizable parameters will be typically be far less due to limitations including spectral overlap of fluorescent dyes.

CyTOF utilizes an entirely different technique to quantify protein expression levels on a single cell level: the use of transition element isotopes to label antibodies.  The quantities of isotopes bound to each cell are then analyzed by a time-of-flight mass spectrometer.  While compensation issues due to spectral overlap between fluorophores limits the effective number of parameters assessable by fluorescence-based flow cytometry to far below the theoretical maximums, CyTOF does not suffer from these limitations as there is no requirement for compensation.  In addition, as the metal isotopes used are rare, there is no autofluorescence of cells, another limitation of fluorescence-based flow cytometry. Proof of principle studies have been published by Gary Nolan and colleagues at Stanford University, and have demonstrated the simultaneous use of 34 cell surface and intracellular parameters.  The CyTOF instrument can theoretically detect up to 100 isotopes, thus far extending the ability of researchers to simultaneously assess the expression of many more proteins per cell.

The CyTOF instrument is commercially available from DVS Sciences.  DVS Sciences also offers an expanding list of pre-conjugated metal isotope-labeled antibody reagents and additionally a MAXPAR® labeling kit for conjugation of other antibodies to 33 different metals, allowing researchers to select many additional antigens of interest for analysis.

I have previously stressed the importance of studying cell biology on the single cell level in order to understand the relationships that occur between expression of proteins and signaling states in unique cell populations and on the single cell level.  The addition of CyTOF to the reseracher’s arsenal will allow these types of questions to be addressed on an even more complex level.


Additional Reading:

The history and future of the fluorescence activated cell sorter and flow cytometry: a view from StanfordHerzenberg LA, Parks D, Sahaf B, Perez O, Roederer M, Herzenberg LA. Clin Chem. 2002 Oct;48(10):1819-27.

Single-cell mass cytometry of differential immune and drug responses across a human hematopoietic continuum.  Bendall SC, Simonds EF, Qiu P, Amir el-AD, Krutzik PO, Finck R, Bruggner RV, Melamed R, Trejo A, Ornatsky OI, Balderas RS, Plevritis SK, Sachs K, Pe’er D, Tanner SD, Nolan GP. Science. 2011 May 6;332(6030):687-96. doi: 10.1126/science.1198704.

Mass cytometry: technique for real time single cell multitarget immunoassay based on inductively coupled plasma time-of-flight mass spectrometry.  Bandura DR, Baranov VI, Ornatsky OI, Antonov A, Kinach R, Lou X, Pavlov S, Vorobiev S, Dick JE, Tanner SD. Anal Chem. 2009 Aug 15;81(16):6813-22. doi: 10.1021/ac901049w.

Cytometry by time-of-flight shows combinatorial cytokine expression and virus-specific cell niches within a continuum of CD8+ T cell phenotypes. Immunity. 2012 Jan 27;36(1):142-52. doi: 10.1016/j.immuni.2012.01.002.

Tricks for analyzing PBMC populations by flow cytometry

photo credit: PNNL – Pacific Northwest National Laboratory via photopincc