Potential of BDNF in Treating Neurodegenera­tive Disorders

Neurodegenerative diseases are characterized by usually fatal and progressive nervous system dysfunction caused by the death of neurons in the brain and spinal cord. In terms of human suffering and economic cost, neurodegenerative disorders carry an immense disease burden. However, despite extensive clinical research, especially in developing disease-modifying therapeutics, there is no effective medicine that halts or even slows any neurodegenerative disease. Currently in the United States, over 5 million Americans suffer from Alzheimer’s disease (AD), 1 million from Parkinson’s (PD), 400,000 from multiple sclerosis (MS), 30,000 from amyotrophic lateral sclerosis (ALS), and 30,000 from Huntington’s disease (HD). Thus, modification of current therapeutic research strategies and a more aggressive approach is a goal of increasing urgency.

clinical trials,alzheimer's,parkinson's,huntington's,clinical research,phase III

Thus far, the majority of clinical research for treatment of neurodegenera­tive diseases has utilized disease-modifying therapeutics, which either prevent or target elimination of the pathogenetic causes or neurotoxins resulting from the disease. The basis for this approach revolves around several characteristics implicated in neurodegenerative diseases, such as accumulation of neurotoxic substances, autophagy and inflamma­tion, as well as aggregation of misfolded proteins in neurodegenerative disorders, such as amyloid-β (Aβ) aggregates in AD or the mutant Huntington protein in HD, which take place prior to neuronal death. However, data obtained from several Phase III clinical trials indicate low efficacy of these treatments, specially in advanced stages of most neurodegenera­tive disorders; this is mainly due to the poor understanding of the underlying mechanisms of these disorders, hence the lack of knowledge of whether the targeted disease-characteristics are the cause or a symptom of the disease. Furthermore, the inability in early and accurate diagnosis of most neurodegenerative disorders impedes the early evaluation of therapeutic efficacy of new therapeutics.

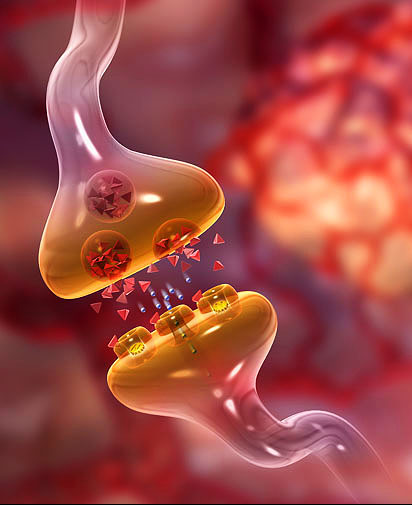
Although the underlying cellular processes contributing to HD, PD and AD differ, one common denominator in all these neurodegenerative diseases is the presence of inadequate neuronal communication, induced by the loss of synapses. Neuronal communication is carried out via synaptic transmission at neuronal synapses. A change in the properties of synaptic transmission due to brain’s ability to dynamically reorganize itself by forming new neuronal synapses is referred to as synaptic plasticity; compensation for injury as well as adjustment of neural activity in response to new stimuli or changes in their environment are among the most critical known functions of synaptic plasticity. Thus, degeneration of synapses leads to the loss of synaptic plasticity, preventing neuronal stimulation and eventual cell death.

Alzheimer's Disease,Parkinson's,Huntington's,BDNF

According to a recent Review article published by scientists from GlaxoSmithKline in the advanced online edition of the Nature Reviews Neuroscience, Lu and colleagues present a compelling notion in treatment of neurodegenerative disorders; they propose a synaptic repair strategy targeting pathophysiology, which directly underlies the clinical syndromes. Unlike neuronal loss, synapse loss is reversible and synaptic dysfunction has the ability to be repaired, which allows the potential of neuronal repair prior to neuronal death. Furthermore, synaptic repair approach can be utilized for any neurological disease, regardless of the type or origin of the toxic byproduct. Lu’s group has proposed utilization of the synaptogenic molecule brain-derived neurotrophic factor (BDNF) as a potential synaptic repair therapeutic agent.

BDNF, an abundant neurotrophin expressed throughout the central nervous system, binds to NTRK2/TRKB and has been identified as one of the key neural signals regulating neuronal survival, neurogenesis and the only neurotrophin factor associated with synaptic plasticity in humans. Furthermore, in addition to its neuroprotective attribute, previous studies have demonstrated the key role of BDNF in cognitive functions, and synaptic deficit repair despite the presence of accumulated toxic proteins.

In this review, Lu’s team suggest potential routes of activating the BDNF pathway, as well as the importance of developing of a more reliable technique for quantification of synaptic changes in clinical settings, as essential tools in building effective disease-modifying therapies for neurodegenerative disorders. Although the notion of synaptic repair is an attractive one, the utilization of this strategy is still not feasible for the late stages of the disease, in which the irreversible neuronal death has already occurred. Furthermore, since most neurodegenerative diseases are diagnosed after the onset of neuronal death, emphasis on late stage treatment must remain a priority in neurodegenerative clinical research.


Further Reading:

BDNF-based synaptic repair as a disease-modifying strategy for neurodegenerative diseases

Using Application Settings to Standardize Flow Cytometry Results Across Experiments and Instruments

While many fluorescence-based flow flow cytometrycytometry assays can be run without concern for hitting the exact same fluorescence intensity target values across different experiments, there are assays that require standardization such that assays run on different days, or even different flow cytometers will render results that can be directly compared.  BD Biosciences has developed a protocol for enabling “Application Settings” on machines running the FACSDiva V6 software, to create settings that allow for standardized consistent fluorescence intensity target values to be obtained across experiments run on different days or instruments.

The ability to collect replicable fluorescence intensity values across assays is invaluable when assays require directly comparable results.  This can easily be envisioned for use in the clinical setting where specifically defined expression levels of a given marker may be used for prognostic or diagnostic indications or therapeutic responses.  Other examples include assays where the number of samples is too large for an experiment to be logically performed on a single day, or time series experiments where samples will be assayed for the same parameters and assessed for their changes over time.

Creating an optimized Application Settings for a given antibody staining panel requires several steps and the understanding of several principles of flow cytometry, and a thorough reading of the protocol referenced at the end of the article is recommended.  Here I will discuss the basics for generating Application Settings and using them on the same cytometer.  For a more detailed explanation of the procedure and how to apply this to additional instruments which have the exact same laser and detector configurations, please refer to BD’s protocol.

In the first step of this protocol, the user runs the standard Cytometer Setup and Tracking (CS&T) software using the CS&T beads.  This will determine the optimized photomultiplier (PMT) detector voltages for the CS&T beads to minimize electronic noise while maintaining the brightest fluorescence staining in the linear range of the detector.  However, these voltages are optimized for these beads and not for cells.  Thus, once the CS&T report is generated, the next step is to optimize the settings for the cells and stains of interest.

In the next step of this protocol, the objective is to adjust the voltage settings to optimize the balance between the electronic noise and the linear range for each detector using the same cells and fluorescent antibody stains for which the application settings are being created.  The negatively stained cell populations are desired to be located above the noise on the low end, and the positively stained cell populations need to be within the linear range of the measurement.

The electronic noise robust standard deviation (rSDEN) is determined by the CS&T software and indicated in the CS&T report for each detector.  To determine the optimal location between the noise and background for the negatively stained cell populations, a calculation of 2.5 x rSDEN is made for each detector.  Then the voltages are adjusted while running the negatively stained cells to place them at this median fluorescence intensity (MFI) value for every detector being used.

After adjusting for all of the negative populations, the positively stained cells must be assessed to ensure that the cells are still within the detector’s linear range.  The CS&T report also generates a linearity max channel value for each detector.  Thus, the MFI of the positively stained population should be below this value, and allow for any anticipated increases in expression to remain below this value.  Remaining within the linear range is more important than having the negative populations at the 2.5 x rSDEN levels.  Thus, when there is very bright staining, this is important to keep in mind and the voltage should be lowered accordingly.

Finally, after the user has adjusted the voltages to the optimal settings for each detector, the application settings can be saved using the FACSDiva V6 software under: Cytometer Settings -> Application Settings -> Save.

Once the application settings have been created, they can be applied in any future experiments.  To use them, following daily CS&T cytometer setup and performance checks, open a new experiment.  Apply the Use CS&T Settings selection.  Then open the application settings under: Cytometer Settings -> Application Settings -> Apply.  Now consistent MFIs should be obtained for cells run on different experimental days.  One final note is that additional considerations need to be taken if the baseline target values change over time, or a new lot of CS&T beads is used for the daily cytometer setup.  The BD protocol discusses what to do in these instances.

Protocol:

Standardizing Application Setup Across Multiple Flow Cytometers Using BD FACSDiva™ Version 6 Software.  Ellen Meinelt, Mervi Reunanen, Mark Edinger, Maria Jaimes, Alan Stall, Dennis Sasaki, Joe Trotter.

Upcoming Immunology Conferences: July – September, 2013

I previously posted on  Immunology Conferences: March- June, 2013 and 2013 Conferences in Tumor Immunology and Cancer Immunotherapy

This listing will include upcoming Immunology-related conferences from July – September, 2013.


July:

Frontiers in Immunology Researchdescribe the image

July 1 – 4, 2013.

Monte Carlo, Monaco


14th International TNF Conference

July 7 – 10, 2013.

Loews Le Concorde, Quebec, Canada.

Travel grant application deadline: April 5, 2013.

Early Registration deadline: April 5, 2013.


British Society of Allergy & Clinical Immunology Annual Meeting: Allergy Across the Ages

July 8 – 10, 2013.

The International Centre, Telford, UK.

Abstract submission deadline: April 8, 2013.

BSACI membership deadline: June 10, 2013.

Travel fellowship deadline: May 20, 2013.

Early Registration deadline: May 26, 2013.


FASEB Conference: Autoimmunity

July 7 – 12, 2013

Saxtons River, Vermont, USA.

Early Registration deadline: June 3, 2013.


AAI Introductory Course in Immunology

July 13 – 18, 2013.

University of Pennsylvania, Philadelphia, PA, USA.

An intensive introductory immunology course.

Registration deadline: June 28, 2013.


FASEB Conference: Molecular Mechanisms of Lymphocyte Development and Function

July 14 – 19, 2013.

Steamboat Springs, Colorado, USA.

Early Registration deadline: June 3, 2013.


16th International Congress of Mucosal Immunology (ICMI 2013)

July 17 – 20, 2013.

Westin Bayshore Vancouver, Vancouver, Canada.

Late Breaking Abstract Submission Deadline: April 15, 2013.


The American Society for Virology 32nd Annual Scientific Meeting

July 20 – 24, 2013.

Pennsylvania State University, State College, PA, USA.

Early Registration Deadline: May 31, 2013.

T Follicular Helper Cells: Basic Discoveries and Clinical Applications

July 21 – 26, 2013.

The Chinese University of Hong Kong, Hong Kong, China.

Short-talk abstracts deadline: May 15, 2013.

Application deadline: June 23, 2013.

AAI Advanced Course in Immunology
July 28 – August 2, 2013.

Seaport World Trade Center, Boston, MA, USA.

Registration deadline: July 12, 2013.


August:

FASEB Conference: Gastrointestinal Tract XV: Epithelia, Microbes, Inflammation and Cancer

August 11–15, 2013.

Steamboat Springs, Colorado, USA

Registration deadline: July 3, 2013.


14th European Meeting on Complement in Human Disease (EMCHD)

August 17-21, 2013.

Jena, Germany.

Early registration deadline: June 21, 2013.


15th International Congress of Immunology

August 22-27, 2013.

MiCo – Milano Congressi, Milan, Italy.

Late Abstract Deadline: June 30, 2013.

Early Registration Deadline: April 15, 2013.


Immune-related Pathologies: Understanding Leukocyte Signalling and Emerging therapies (IMPULSE 2013)

August 31– September 3, 2013.

Mátraháza, Hungary

Abstract Submission Deadline: June 15, 2013.

Early Registration Deadline: June 15, 2013.


September:

ESF-EMBO Symposium: B Cells From Bedside To Bench And Back Again

September 2–7, 2013.

Pultusk, Poland.

Application Deadline: June 3, 2013.


7th Leukocyte signal Transduction Conference

September 8 – 13, 2013.

Grecotel Kos Imperial Hotel, Kos, Greece.

Early Registration Deadline: June 15, 2013.

Abstract Submission Deadline: June 15, 2013.

Travel Award Application Deadline: June 30, 2013.

2nd International Conference on ImmunoMetabolism: Molecular and Cellular Immunology of Metabolism

September 15–20, 2013.

Sheraton Conference Center, Rhodes, Greece.

Abstract Submission Deadline: June 15, 2013.

Early Registration Deadline: June 15, 2013.

Travel Award Application Deadline: June 30, 2013.


Cytokines 2013: From Molecular Mechanisms to Human Disease

September 29 – October 3, 2013

Hyatt Regency San Francisco, San Francisco, CA, USA.

Early Registration Deadline: May 7, 2013.

Abstract Submission Deadline: May 7, 2013.

A free iPhone/iPad App for the meeting is now available!

The Android version will be out very soon.


3rd International Lymphoid Tissue Meeting

September 15–17, 2013.

Rotterdam, The Netherlands.

Abstract Submission Deadline: July 1, 2013.

Early Registration Deadline: July 15, 2013.


Websites that list upcoming Conferences & Events in Immunology, Tumor Immunology, and Cancer Immunotherapy:

The American Association of Immunologists (AAI) Meetings and Events Calendar

Nature Reviews Immunology’s list of conferences

Cancer Immunity Journal’s List of Conferences

FASEB Scientific Research Conferences Calendar 


NOVEL ERK INHIBITOR SENSITIZES MAPK INHIBITOR RESISTANT CELLS

In recent years, “targeted” cancer therapies have shown promising results. With the discovery and development of “personalized” novel cancer treatments encouraging clinical responses in a subset of patients with advanced systemic disease have been observed.

This has been particularly evident with several of the recently developed kinase inhibitors that target oncogenic forms of EGFR, HER2, BCR-ABL, ALK, JAK2, and BRAF. In addition, several MEK inhibitors are developed to target oncogenic RAS. Although these drugs initially exhibit responses, they fail to sustain results due to the emergence of acquired resistance. The median duration of response with the EGFR inhibitor gefitinib (Iressa®, FDA approved) in non-small cell lung cancer patients is 7 months. Additionally, response duration for the BRAF inhibitor vemurafenib is approximately 6-7 months.  In phase II clinical trials, median progression free survival time in patients bearing K-RAS mutant tumors treated with selumetinib (MEK inhibitor) was 5.3 months. Multiple mechanisms are associated to limiting the efficacy of these targeted agents. Therefore, further studies are needed to develop effective strategies to overcome the aquisition of resistance to targeted agents. Formulation of effective drug combinations as well as identification of novel compounds with anti-neoplastic properties could be useful in this context.


MEK signal transduction

A recent study by Morris and colleagues published in Cancer Discovery (April 29th, 2013) reported the identification and characterization of a novel and selective ERK inhibitor. This inhibitor was found to induce tumor regression in BRAF, NRAS, and KRAS xenograft models and also inhibited MAPK signaling and cell proliferation in BRAF or MEK inhibitor resistant models. In addition, this ERK inhibitor was found to be effective in tumor cells that are resistant to concurrent treatment with BRAF and MEK inhibitors.

In this study, Morris et al. screened nearly 5 million compounds’ ability to bind the unphosphorylated form of ERK2 and observed ATP competitive compound, SCH772984, selectively bound and inhibited ERK1/2 activity at a nanomolar range. SCH772984 was effective in blocking ERK activation in a dose-dependent manner in V600EBRAF mutant and KRAS mutant cell lines. A known mechanism of resistance to MAPK inhibitors is via negative feedback activation of the MAPK pathway through ERK activation (for details please refer to my previous post titled “resistance to BRAF inhibitors in melanoma”). In this study, negative feedback activation via increased ERK phosphorylation was also observed following treatment with SCH772984. However, SCH772984 was found to be effective in blocking further downstream signaling of ERK as it maintained complete inhibition of ERK substrate p90 ribosomal S6 kinase.

Next, to test the efficacy of SCH772984 in the context of clinically observed resistance mechanisms to the MAPK inhibitors (such as BRAF amplification, MEK1 mutation, RAS mutation), researchers generated resistant cell lines and tested the efficacy of SCH772984. In all scenarios tested, sensitivity to SCH772984 treatment was observed as compared to the MAPK inhibitors. A recent clinical study concurrently treated patients with BRAF and MEK inhibitors and found to double the progression free survival period in patients whose tumors harbored MAPK activation especially in V600EBRAF mutant melanoma.

In the near future this combination could potentially become the standard-of-care for V600EBRAF mutant melanoma. However, due to heterogeneous nature of tumor cells, it is possible that acquired resistance may emerge to this combination treatment. To that end, Morris et al. tested the efficacy of SCH772984 in BRAF and MEK inhibitor combination resistant models of melanoma and colorectal cancer. Reduced activation of ERK and inhibition of cellular proliferation was noted in this model following SCH772984 treatment.

Taken together this study implicates a new ERK inhibitor SCH772984 that may exhibit encouraging therapeutic responses for the treatment of patients with BRAF, NRAS, and KRAS mutations including patients who relapse on current BRAF or MEK inhibitor therapy.


References:

1. Akinleye A, Furqan M, Mukhi N, Ravella P, Liu D. MEK and the inhibitors: from bench to bedside. J Hematol Oncol. 2013;6:27.

2. Cohen MH, Williams GA, Sridhara R, Chen G, Pazdur R. FDA drug approval summary: gefitinib (ZD1839) (Iressa) tablets. Oncologist. 2003;8:303-6.

3. Morris EJ, Jha S, Restaino CR, Dayananth P, Zhu H, Cooper A, et al. Discovery of a novel ERK inhibitor with activity in models of acquired resistance to BRAF and MEK inhibitors. Cancer Discov. 2013.

When can B cells make IL-17?

IL-17 cytokines are best known for their roles in describe the imageimmune defense against bacterial and fungal infections and in the pathogenesis of inflammatory autoimmune diseases including rheumatoid arthritis(RA), multiple sclerosis(MS), and psoriasis.   Cells that are known to be producers of IL-17 include CD4+ TH17 T cells, CD8+ TC17 T cells, type 3 innate lymphoid cells (ILC3/lymphoid tissue-inducer cells), gd T cells, and NKT cells.  However, in a recent article in Nature Immunology, Bermejo et. al demonstrate that B cells are primary producers of IL-17 during infection with the protozoan parasite,Trypanosoma cruzi.  Furthermore, B cells activated IL-17 production through an entirely novel pathway.

IL-17 comprises a family of six related homo- or hetero-dimeric functioning cytokines (IL-17A – IL-17F) that signal through a complex family of multimeric IL-17 receptors (IL-17RA – IL-17RE).  IL-17 cytokines activate a unique signaling pathway through the adaptor protein Act1 which leads to induction of several transcription factors including NF-kB, IκBζ, C/EBPδ, C/EBPβ, MAPK, and PI3K.

In the study by Bermejo et. al, the authors sought to identify all of the cell types producing IL-17 during in vivo infection of mice with T. Cruzi.  Interestingly, the majority of splenic cells producing IL-17 at 10 and 19 days post-infection were CD3 and instead expressed CD19 and B220, markers of B cells.  Further characterization of these cells revealed expression of the plasmablast marker CD138, but not germinal center B cell markers.  IL-17+B220+ cells were absent in T. Cruzi infected B cell-deficient μMT mice and these mice were less able to control the infection and had higher levels of IFN-gamma and TNF.  Thus, B cells were not only the major IL-17 producers during T. Cruzi infection, but played a major role in protective immune responses and limiting immune pathology.

In mice, the generation of IL-17 producing TH17 cells is driven by IL-6, IL-23, and the transcription factors RORgammaT, ROR-alpha, and Ahr.  However, IL-17 producing B cells were still generated in T. Cruzi infected mice or B cells lacking IL-6, IL-23R, RORgammaT, Ahr, or treated with inhibitors of ROR-alpha.  In vitro exposure of purified B cells to T. Cruzi induced production of IL-17; however this was not mimicked by incubation of B cells with TLR2, TLR4, or TLR9 ligands, further indicating the lack of a role for inflammatory cytokines upregulated by TLRs in inducing IL-17 in B cells.  T cells did not produce IL-17 in response to T. Cruzi.  Thus the known regulators of IL-17 producing cells were not involved in the unique induction of IL-17 in B cells by T. Cruzi.

The authors focused on T. Cruzi trans-sialidase, a surface GPI-anchored enzyme, as being the potential IL-17 inducing signal, due to its previously described activity as a B cell mitogen.  Treatment of B cells with recombinant enzymatically active trans-sialidase recapitulated IL-17 production and a blocking antibody against the enzymatic site of trans-sialidase completely inhibited the induction of IL-17 during T. Cruzi exposure.  Through a series of experiments, the authors determined that trans-sialidase-mediated sialylation of the surface marker CD45 was required for B cell IL-17 production.  The signaling pathway downstream of CD45 leading to IL-17 induction was found to involve Src kinases, Btk, and Tec.

Finally, the authors examined if this phenomenon occurs in human B cells as well.  CD19+ B cells were isolated from tonsils and the production of IL-17 was also seen in response to T. Cruzi exposure in a CD45 and Btk dependant fashion.

In conclusion, this was an exciting study that demonstrated not only that B cells are major IL-17 producers during parasitic infections, but also identified a unique signaling pathway that mediates this effect in both mice and humans.  Many questions remain about how this unique signal transduction pathway operates only in plasmablast B cells but not other cell types, despite the widespread expression of CD45 by hematopoietic cells.  Furthermore, the role of IL-17 production by B cells in immune responses to other pathogens that express trans-sialidases as well as the role for these B cells in IL-17-driven immune pathologies remains to be explored.

Further Reading:

Trypanosoma cruzi trans-sialidase initiates a program independent of the transcription factors RORγt and Ahr that leads to IL-17 production by activated B cells.  Bermejo DA, Jackson SW, Gorosito-Serran M, Acosta-Rodriguez EV, Amezcua-Vesely MC, Sather BD, Singh AK, Khim S, Mucci J, Liggitt D, Campetella O, Oukka M, Gruppi A, Rawlings DJ. Nat Immunol. 2013 May;14(5):514-22. doi: 10.1038/ni.2569.

IL-17-producing B cells combat parasites.  León B, Lund FE. Nat Immunol. 2013 May;14(5):419-21. doi: 10.1038/ni.2593.

Recent advances in the IL-17 cytokine family.  Gaffen SL. Curr Opin Immunol. 2011 Oct;23(5):613-9. doi: 10.1016/j.coi.2011.07.006.

Development and evolution of RORγt+ cells in a microbe’s world.  Eberl G. Immunol Rev. 2012 Jan;245(1):177-88. doi: 10.1111/j.1600-065X.2011.01071.x.


New in MS Research: Interplay Between IFN-beta, B-cells and Monocytes

Multiple sclerosis (MS) is a chronic autoimmune inflammatory disease of the central nervous system (CNS), characterized by the presence of scar tissues (plaques) localized within the brain’s white matter and spinal cord. These plaques are results of myelin-degeneration (demyelination) and axonal death. Although MS has been classically considered to be a T-cell-mediated disease, the high efficacy of B cell-depleting therapies have demonstrated the critical role of B-lymphocytes and the humoral immune response in MS pathogenesis, albeit the underlying mechanisms remain unclear. In approximately 90% of MS patients, there is increased levels of intrathecally synthesized IgG in the MS-plaques as well as Cerebral Spinal Fluid (CSF), which manifests B-cell clonal expansions within the CNS.

B-cell-lineage cells differentiate into antibody-secreting plasma cells that are the source of persistent IgG, in the presence of key factors such as interleukin-6 (IL-6), B-cell-activating factor of the TNF family (BAFF) and a proliferation-inducing ligand (APRIL). IL-6 promotes terminal differentiation of B cells to plasma cells and is essential for the survival and Ig secretion. In conjunction with APRIL, BAFF regulates, B-cell survival, differentiation and is essential for initiation of T-cell independent B-cell responses. 

B cell resized 600

Type I IFNs (IFN-α, IFN-β, IFN-κ, and IFN-ω) are cytokines expressed by many cell types in response to viral or microbial infections, which bind to- and trigger specific Toll-like receptors (TLRs) that induce a large number of genes modulating and linking the innate and the adaptive immune responses.

Despite the development of other new treatments, IFN-β has been the first-line disease-modifying drug treatment for patients with relapsing-remitting multiple sclerosis (RRMS). Thus, understanding the molecular mechanisms of the anti-inflammatory effect of IFN-β in RRMS may provide insight into MS pathogenesis.  

TLRs are a family of non-catalytic pattern recognition receptors that recognize and bind to specific molecular patterns of pathogen-derived and endogenous damage-associated components. In addition to their key role in mediating innate immunity, TLRs have also been shown to play an important part in the activation of the adaptive immune system by inducing proinflammatory cytokines such as TNF-α, IL-1, IL-6, IL-12, and IFN.

Several studies have shown that of the 11 TLRs identified in humans, endosomal TLRs 7, 8 and 9 which recognize pathogen-derived and synthetic nucleic acids, also recognize endogenous immune complexes containing self-nucleic acids in certain autoimmune disorders such as MS. Interestingly, B-cells express both TLR7 and TLR9. TLR7 recognizes guanosine- and uridine-rich single-stranded RNAs (ssRNAs), whereas TLR9 recognizes hypomethylated CpG-rich double-stranded DNAs.  Upon activation by their specific ligands, these TLRs induce B cell proliferation and differentiation into Ig-secreting cells.

describe the image

In a recent study published in the European journal of Immunology, Coccia’s group has demonstrated the essential interactions between monocytes and B cells for the release of effective humoral immune response that elicits TLR7-mediated -induced B-cell differentiation into Ig secreting cells. Furthermore, they have shown a clear deficiency in this cross-talk interaction in MS patients; the peripheral blood mononuclear cell (PBMC) of MS patients exhibit substantially lowered TLR7-induced Ig production (compared to Healthy donors). However, results obtained after one-month long IFN-β therapy showed that lower humoral immune response in MS subjects was replenished, through IFN-β–induced secretion of TLR7- triggering cytokines, which mediated the selective increase in IgM and IgG to levels comparable to Healthy donors’. This data revealed that the IFN-β enhancement of TLR7-induced B-cell responses in MS patients occurs in at least two steps: 1) Regulation of TLR7 gene expression, and 2) Secretion of B-cell differentiation factors, in particular IL-6 and BAFF.

Finally, the last and perhaps the most significant finding of Coccia’s new study, is reporting, for the first time, the presence of a defect in TLR7 gene expression and signaling in monocytes of MS patients. Lack of TLR7-driven IgM and IgG production, absence of IL-6 and a significant reduction in BAFF expression in samples of MS patient-IFN-β treated PBMCs that were depleted of monocytes, evince IFN-β therapeutic mechanism by fine-tuning monocyte functions, through stimulation of TLR7 which subsequently effects B cell differentiation.

The discovery of the tight regulation of both TLR expression and TLR-induced responses in maintenance of immune environment’s homeostasis, as well as IFN-β-mediated- TLR7 function recovery are indicative of the critical changes in PBMC microenvironment induced by IFN-β therapy; within this microenvironment, leukocyte subsets establish critical immune regulatory interactions which determine the fate of the host’s immune tolerance processes.

Coccia’s new study has revealed new insights, which are not only crucial for the better understanding of the MS immunopathology, but also significant for development of new MS therapeutic strategies which target TLR expression and/or TLR-induced responses.


Further Reading:

IFN-β therapy modulates B-cell and monocyte crosstalk via TLR7 in multiple sclerosis patients.

GENETIC AND EPIGENTIC CHANGES IN ACUTE MYELOID LEUKEMIA

Acute myeloid leukemia (AML), a cancer of hematopoietic cells, is a molecularly heterogeneous disease. AML is associated with several genetic changes that alter normal hematopoietic growth and differentiation, resulting in the accumulation of large numbers of abnormal immature myeloid cells in the bone marrow and peripheral blood. These cells are capable of dividing and proliferating, but cannot differentiate into mature hematopoietic cells. Recurrent structural alterations of chromosomes are the established diagnostic and prognostic markers in AML. Several studies using targeted sequencing (determination of DNA sequence of specific areas of interest within the genome) identified recurrent gene mutations that contained diagnostic and prognostic information, including mutations in FLT3, NPM1, KIT, CEBPA, and TET2 genes. In addition, massively parallel sequencing (high-throughput approaches of DNA sequencing, also called next-generation sequencing) has discovered recurrent mutations in DNMT3A and IDH1/2 genes that may also provide prognostic information for some patients. Even though these genetic abnormalities may play an essential role in the pathogenesis of AML, nearly 50% of AML patients have normal karyotype (an organized profile of a person’s chromosomes).No. of mutations in AML resized 600 Based on the cytogenetic analysis, AML patients are classified into three major risk categories: favorable, intermediate and unfavorable. AML patients with PML-RARA, RUNX1-RUNX1T1, or MYTH11-CBFB gene fusions (as a result of chromosomal rearrangements) profile belong to favorable- risk category and have shown relatively good response to chemotherapy. Patients with complex genetic alterations (e.g. monosomy karyotype) are categorized into unfavorable-risk profile. Majority of the AML patients exhibit normal karyotype and belong to intermediate-risk category. Some of these patients respond well to chemotherapy while others don’t. Since nearly 50% of AML patients have normal chromosomal profile, better molecular characterization of pathogenesis of AML is required for better approaches to therapy. In addition, next-generation sequencing (NGS) studies have revealed that even though AML usually harbor hundreds of mutated genes, only a limited number of mutated  genes serve as driver mutations (i.e. causing the tumor). Among the different adult cancer types sequenced extensively so far, AML has had the fewest mutations discovered. Therefore, identification of a significant number of novel driver mutations present at low frequency in AML will help to better understand the leukemogenesis.

A study recently published in the New England Journal of Medicine (May 1st, 2013) by researchers at The Cancer Genome Atlas (TCGA) group led by Timothy J. Ley broadly classified the genomic alterations that frequently underlie the development of AML. This study also suggested potential new drug targets and treatment strategies for AML. In this study the genome of 200 newly diagnosed adult cases of AML patients, representing all of the known subtypes, was analyzed by performing whole-genome sequencing (50 cases) and whole-exome sequencing (150 cases). In addition, RNA and micro-RNA sequencing and DNA-methylation analysis was also performed. 

Each AML genome was compared to the describe the imagenormal genome derived from a skin sample of the same patient. The recurrently mutated genes discovered in this study were grouped into nine categories that were defined according to biologic function and that are considered to play a role in AML pathogenesis. Some of these groups include: tumor suppressor genes, transcription-factor fusions, activated signaling genes and epigenetic modifiers (DNA-methylation related genes and chromatin-modifying genes) with the latter being the most frequently mutated class of genes found in this study. At least one potential driver mutation was identified in nearly all AML samples including genes that are well established as being associated with AML pathogenesis (eg. FLT3, NPM1, DNMT3A, IDH1, IDH2, and CEBPA).

This study was the first to observe recurrent mutations in cohesin genes, which are important in cell division, in 13% of cases of AML samples. In addition, this study also observed a mutation in microRNA 142 (miR-142). Overall this study provided a detailed understanding of the genetic and epigenetic changes associated with adult de novo AML. Future studies are warranted to understand the relationship between these alterations and treatment results.


References:

1. Bacher U, Schnittger S, Haferlach T. Molecular genetics in acute myeloid leukemia. Curr Opin Oncol. 2010;22:646-55.

2. Stirewalt DL, Radich JP. The role of FLT3 in haematopoietic malignancies. Nat Rev Cancer. 2003;3:650-65.

3. Yamashita Y, Yuan J, Suetake I, Suzuki H, Ishikawa Y, Choi YL, et al. Array-based genomic resequencing of human leukemia. Oncogene. 2010;29:3723-31.

4. Network TCGAR. Genomic and Epigenomic Landscapes of Adult De Novo Acute Myeloid Leukemia. N Engl J Med. 2013.

The nuances of using CFSE to monitor lymphocyte proliferation

Measuring proliferation of lymphocytes such as T cells isolated from peripheral blood monuclear cells (PBMC) using carboxyfluorescein diacetate succinimidyl ester (CFSE) is not a foolproof protocol.  CFSE can be toxic to cells and non-optimal CFSE labeling conditions can thus hamper proliferation of cells and obscure interpretation of results.  An article in Nature Protocols by Quah et al., details CFSE labeling conditions and how to achieve optimal results.

CFSE is a fluorescent cell membrane permeable dye with similar excitation and emission properties as fluorescein isothiocyanate (FITC).  Thus CFSE can be assayed in flow cytometry by the same channels that detect the fluorescence intensity of FITC.  The CFSE precursor, carboxyfluorescein diacetate succinimidyl ester (CFDA-SE) that is used to label cells is non-fluorescent, but once inside cells, acetate groups are removed by intracellular esterases, causing the resulting CFSE molecule to become fluorescent and also less membrane permeable.  Furthermore, the succinimidyl ester group of CFSE covalently couples to primary amine groups, thus remaining bound to proteins inside cells for long time periods.  As a cell divides, the intensity of CFSE staining in the resultant daughter cells will be half that of the parent, allowing easy flow cytometric assessment of the number of cell divisions that have occurred since labeling.

While CFSE is commonly used to assess lymphocyte proliferation, CFSE can be toxic and impair cell division.  According to Quah et al., four parameters of the labeling conditions must be considered to minimize this toxicity:

1. The concentration of the cells.

2. The concentration of CFSE.

3. The duration of cell labeling.

4. The presence of amino acids in the labeling media.

CFSE will bind to free amines in aqueous conditions and thus reduce the remaining CFSE concentration. To avoid the loss of CFSE to amino acids in the labeling media, PBS is the recommended diluent for CFSE prior to adding to cells.  Cells are uniformly suspended in PBS with serum, and the CFSE/PBS stock is immediately mixed rapidly with the cells and allowed to incubate for the optimal amount of time.

Regarding cell and CFSE concentration, these two parameters must be considered in the context of the other.  Cells at higher concentrations can be labeled with higher concentrations of CFSE with a minimal effect of CFSE toxicity on cell division.  For instance, cells at a concentration of 50 x 106/ml can be labeled with 5uM CFSE, but cells at a concentration of 1 x 10⁶/ml will experience significant toxicity if labeled with 5uM CFSE but will do well with 1uM CFSE.  The time of labeling is also important, and longer incubation times will increase toxicity.  Quah et al. recommended 5 minutes of incubation with CFSE before washing the cells.

To assess proliferation, after CFSE labeling, cells are washed and then stimulated with a mitogenic signal.  For instance, T cells can be stimulated with anti-CD3 + anti-CD28, PHA, SEB, PMA + ionomycin or other stimuli.  Then the cells will be allowed to divide for a number of days which must also be optimized depending on the stimulus used.

T cells will die if left unstimulated in vitro and as they proliferate, they can undergo activation induced cell death (AICD).  Thus, some amount of cell loss must be anticipated.  In an accompanying protocol in Nature Methods, Hawkins et al. detail the incorporation of cell count beads during flow cytometry to more accurately measure the degree of cell proliferation.

Thus, there are many nuances to consider when using CFSE to label cells for assays such as proliferation.  I recommend reading both of these protocols to achieve robust assay performance.

Further Reading:

Monitoring lymphocyte proliferation in vitro and in vivo with the intracellular fluorescent dye carboxyfluorescein diacetate succinimidyl ester.  Quah BJ, Warren HS, Parish CR. Nat Protoc. 2007;2(9):2049-56.

Measuring lymphocyte proliferation, survival and differentiation using CFSE time-series data.  Hawkins ED, Hommel M, Turner ML, Battye FL, Markham JF, Hodgkin PD. Nat Protoc. 2007;2(9):2057-67.


Tissue Resident CD8+ Memory T cells: A front line defense?

Memory CD8+ T cells continually Tcell cytolysis
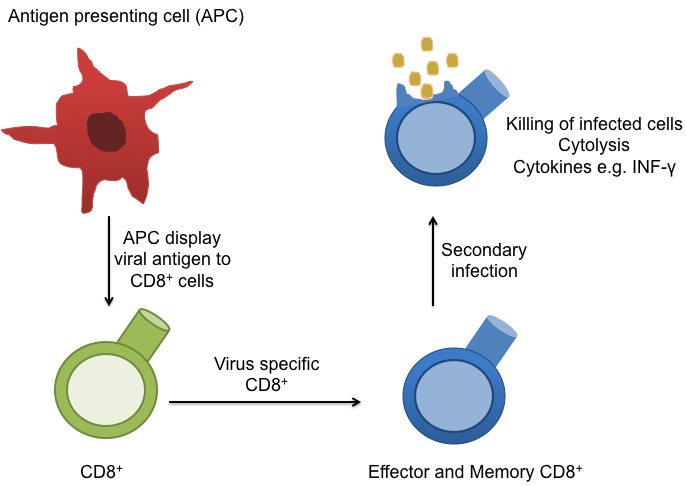
circulate in the blood, lymph, and secondary lymphatic organs as they patrol for the presence of secondary infections.  Recently, a class of effector memory CD8+ T cells has also been shown to migrate to and reside long-term in non-lymphoid tissues. These tissue resident memory T cells can quickly respond to tissue infections with their cognate pathogen.  CD8+ T cells mainly function in killing of infected cells though cytolysis and by producing effector cytokines, including IFN-gamma to activate other immune cells.  In a recent article in Nature Immunology, Schenkel et. al demonstrate an additional function for these tissue resident memory CD8+ T cells: as major producers of chemokines that recruit circulating memory T cell forces to the site of infection.

In this study, Lymphocytic choriomeningitis virus (LCMV) was injected intraperitoneally into female mice that had been adoptively transferred with naïve TCR transgenic CD8+ T cells specific for the gp33 epitope expressed by LCMV.  Two months later, mice were transcervically infected with a Vaccinia virus strain engineered to express gp33 (VV-gp33) and the kinetics of the CD8 T cell recall response in the mucosal tissues of the female reproductive tract were assessed.  Gp33-specific tissue resident memory CD8+ T cells were required for the rapid (within 2 days) recruitment of additional circulating gp33-specific T cells into the tissues.  However, if the secondary infection was with a Vaccinia virus strain expressing a different antigen (OVA), then relatively few memory T cells were seen accumulating in the reproductive tract tissue.  This specificity was also seen when gp33 versus OVA peptides were transcervically injected into the tissues instead of infection with VV.

To derive the mechanisms underlying the recruitment of T cells to infected tissue sites, chemokine expression was assessed.  CXCL9 as well as multiple other chemokines were found to be rapidly induced in various cells residing in the reproductive tissues including endothelial cells, tissue dendritic cells, and memory CD8+ T cells.  Production of IFN-gamma by the tissue resident memory CD8+ T cells was required for both recruitment of additional memory CD8+ T cells to the site as well as CXCL9 production by endothelial cells.

Antigen presenting cells as well as activated T cells produce copious amounts of IFN-gamma and it is expected that IFN-gamma production would elicit CXCL9 expression as the alternate name of CXCL9 is monokine induced by IFN-gamma (MIG).  In this study however, it was production of IFN-gamma by the antigen-specific (gp33) tissue resident memory CD8+ T cells that was critical in the expression of chemokines such as CXCL9 and further recruitment of additional memory CD8+ T cells into the infected tissues.  Antigen presenting cells alone were not as productive in this process because when the secondary infection was instead performed with an OVA-antigen expressing vaccinia virus, significant numbers of OVA-specific T cells were not recruited to the infected tissues.

Thus, this study demonstrated that antigen-specific CD8+ memory T cells that reside in tissues function to significantly amplify innate immune alarms to secondary infections by recruiting additional circulating CD8+ memory T cells to the infected site.

Further Reading:

Sensing and alarm function of resident memory CD8(+) T cells.  Schenkel JM, Fraser KA, Vezys V, Masopust D. Nat Immunol. 2013 May;14(5):509-13. doi: 10.1038/ni.2568. Epub 2013 Mar 31.

Hidden memories: frontline memory T cells and early pathogen interception.  Masopust D, Picker LJ. J Immunol. 2012 Jun 15;188(12):5811-7. doi: 10.4049/jimmunol.1102695.

Chemokine monokine induced by IFN-gamma/CXC chemokine ligand 9 stimulates T lymphocyte proliferation and effector cytokine production.  Whiting D, Hsieh G, Yun JJ, Banerji A, Yao W, Fishbein MC, Belperio J, Strieter RM, Bonavida B, Ardehali A. J Immunol. 2004 Jun 15;172(12):7417-24.

The Crucial Connection Between Metabolism and the Immune System.

Over the past couple of decades, the field of immunology has been growing at an exponential pace. Today, immunologists that continue to study the intracellular and extracellular components are also creating new therapies that suppress the immune system, increase the immune system, and even fix the dysregulation of the immune system. Likewise, there has been an increase in the study of organism metabolism and intracellular metabolism in various pathologies; such as diabetes and cancer. Interestingly, there is also an increase in studying how immune cells function in terms of their intracellular metabolism, how these metabolic pathways affect the phenotype and activation of immune cells, and how the immune system affects the metabolic functions of its host organism also known as immunometabolism1.

There are multiple metabolic pathways that cells use to make ATP. It has been discovered that some cells may preferentially use the glycolytic pathway to make ATP, even when the components are available for aerobic respiration; an event called the Warburg effect1. On the other hand, some cells may use the glycolytic pathway along with the Krebs cycle and electron transport chain (ETC), known as oxidative phosphorylation (OxPhos), to consume materials to make energy1. However, not all immune cells act alike. For instance, activated neutrophils preferentially use the Warburg effect1.  Interestingly, this metabolic pathway makes the most hydrogen peroxide, which is part of the substance neutrophils use for granulocytic release against pathogens1. Likewise, dendritic cells that have been activated via a toll-like receptor agonist and express inducible nitric oxide synthase (iNOS) are also found to use the Warburg effect and, like neutrophils, the metabolite of iNOS plays a functional role in activated dendritic cells1. Finally, the

macrophage

M1 pro-inflammatory macrophages also use the Warburg pathways to make ATP1. Glycolysis and oxidative phosphorylation are linked when the pyruvate from the glycolytic pathway is used to make acetyl-CoA using the Krebs cycle. Immune cells that use this pathway are activated T-cells, immunosuppressive M2 macrophages, and the pro-inflammatory Th17 T-cells1. Finally, fatty acid oxidation, the process of using lipids to make ATP, is utilized by memory T-cells, regulatory T-cells, and alternatively-activated macrophages1.

Metabolism in the immune system is more than just connected to the cell’s activation. Metabolism is involved in the homeostasis between immune cells as well as between immune cells and their stromal host cells1. Dysregulation of metabolites has been found in many pathologies and the role of metabolite fluctuation caused by host immune cells versus pathogens is an active area of study2. Likewise, metabolism has been shown to be involved in class switching effector T-cells into memory T-cells and is involved in the act of bringing immune cells into quiescence3.

An interesting example of a link between immunity and metabolism can be found in an article published in Nature April 11, 2013 by Tannahill et al. This paper demonstrates that the metabolite succinate, a key component in the Krebs cycle, is integral in lipopolysaccharide-induced macrophage activation4. Furthermore, they demonstrated that the activation of toll-like receptor 4, through LPS stimulation, leads to an increase of intracellular glutamate uptake and upregulation of succinate production under the “gamma-Amminobutyric acid (GABA) shunt” metabolic pathway4. The metabolite succinate then stabilizes hypoxia-inducible factor-1α; a protein that is involved in IL-1β production4. 

The study of metabolism is more than just an academic exercise. Many therapies have been proposed that look at changing the metabolic system for alteration of the dysregulated immune response. One of these is metformin, a drug that is used to help regulate type 2 diabetes2. However, metformin is now actively investigated as an anti-cancer therapeutic, having an effect on changing the tumor immune microenvironment from a pro-tumor phenotype to an anti-tumor phenotype2. As we continue to learn more about the effects of host metabolism on the immune system, the role of the immune system in organism metabolism, and the intracellular metabolic pathways involved in various immune cells during different states of function, we will hopefully be able to develop more therapies that repair immune dysregulation as well as develop immunotherapies for treating various metabolic diseases.

Further Reading

1. Pearce, E. L. & Pearce, E. J. Metabolic pathways in immune cell activation and quiescence. Immunity 38, 633-643, doi:10.1016/j.immuni.2013.04.005 (2013).

2. Mathis, D. & Shoelson, S. E. Immunometabolism: an emerging frontier. Nature reviews. Immunology 11, 81, doi:10.1038/nri2922 (2011).

3. Finlay, D. & Cantrell, D. A. Metabolism, migration and memory in cytotoxic T cells. Nature reviews. Immunology 11, 109-117, doi:10.1038/nri2888 (2011).

4. Tannahill, G. M. et al. Succinate is an inflammatory signal that induces IL-1beta through HIF-1alpha. Nature 496, 238-242, doi:10.1038/nature11986 (2013).