Artifacts and non-specific staining in flow cytometry, Part II

flow cytometryIn Part I, I talked about un-specific binding and Fc-receptor binding. Besides these cases of non-specific binding, there are also other cases of antibody/fluorochrome binding that appears non-specific but that actually represents a real specific interaction – even though it is usually one that is not welcomed. I call these ‘pseudo-artifacts’ and you will read about some really odd stuff here.


(1) Binding of fluorochromes to Fc-receptors

The fact that Fc-receptors (FcR) bind antibodies is obvious, but lesser known is the fact that some of the fluorochrome linked to your antibody can also bind some FcRs.

It has been reported that R-phycoerythrin (PE) can bind to mouse Fc-gamma-RII  (CD16) and Fc-gamma-RIII (CD32) (Takizawa et al.). Furthermore, FcR binding of fluorochromes apparently applies to most or maybe even all cyanine fluorochromes, either alone or in tandem conjugates (Shapiro). So far I found reports for Cy5 (Jahrsdorfer et al.), PE-Cy5 (van Vugt et al.; Steward and Steward; Jahrsdorfer et al.) and APC-Cy7 (Beavis et al.). In this case, human CD64 (Fc-gamma-RI) was suggested to be the culprit of some of the binding (van Vugt et al.; Jahrsdorfer et al.), but binding also to CD64neg leukemia cells has been reported (Steward and Steward), so the role of FcR is not solved for all cases yet.

Þ Potential solution:

(a)  PE: For the binding of PE to mouse CD16/32 the use of a ‘Fc-block’, i.e. adding blocking monoclonal antibody 2.4G2 (rat IgG2b kappa), will avoid the problem (Takizawa et al.).

(b)  Cyanine: If you work with FcR+ cells, especially monocytes, you might consider avoiding cyanine-containing fluorochromes for the staining of your cells of interest.


(2) Binding of fluorochromes to antigen-receptors

Phycoerythrin (PE) and allophycocyanin (APC) are large proteins of 240kD and 110kD respectively that were original derived from cyanobacteria or red algae. As it turns out these phycobiliproteins are also a specific antigen for some T and B cells. Approximately 0.1% of all mouse B cells recognize PE as antigen in a BCR-dependent manner (Pape et al.; Wu et al.). Similar, about 0.02% of all mouse B cells are APC antigen-specific (Pape et al.). Furthermore, about 0.02-0.4% of all gamma-delta-T cells (mouse and human) recognized PE as a specific antigen (Zeng et al.) as well.

Þ Potential solution: Given their low frequency, these cells only pose a problem if you study tiny subsets of B and gamma-delta-T cells. In that case, you should avoid the use of PE for your cells of interest.

(3) Binding of fluorochromes to other receptors or interaction partners

(a) Cross-reactivity of the antibody:  Epitopes might be shared between different proteins, i.e. your antibody might not only recognize your protein in question, but recognizes also a similar epitope of another protein. This is for obvious reasons more likely with polyclonal antibodies.

Þ Potential solution: Usage of monoclonal antibodies reduces the risk of such cross-reactivity. If you suspect a cross-reactivity of your antibody, using a different clone for the same epitope will likely solve this problem.

(b) Intracellular biotin: Biotin is an important component of the cell metabolism. Therefore, biotin is present in the cells and the use of a streptavidin for intracellular staining will lead to binding of the streptavidin also to the cellular biotin.

Þ Potential solution: If you need to use a biotin-conjugated antibody for your intracellular staining you could cover all intracellular biotin by incubation of your cells with unconjugated streptavidin (followed by thorough washing) before the addition of your biotin-conjugated antibody.

(c) FITC charge: FITC is a charged molecule and antibodies with many FITC molecules (i.e. high F/P ratio) result in a highly charged antibody that binds, presumably through electrostatic interactions, nonspecifically to cytoplasmic elements (Hulspas et al.). This seems to be mainly a problem with intracellular staining and not with surface stains.

Þ Potential solution: For this reason FITC is not ideal for intracellular staining and you might try your antibody conjugated to a different fluorochrome.

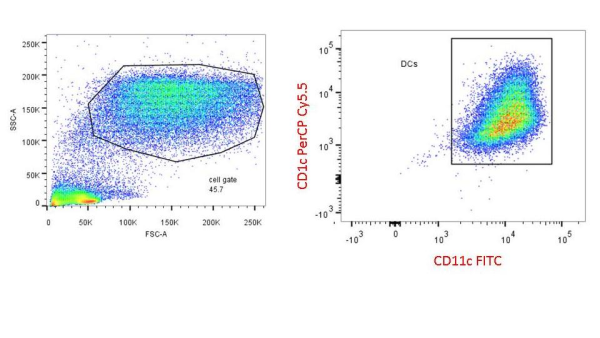
(d) CD205: CD205 (DEC205) is a C-type lectin that is highly expressed on dendritic cells. Recently, it has been demonstrated that PE-Cy5.5 binds with high specificity to mouse CD205 (Park et al.). No staining was observed towards human CD205 and the binding of other Cy5.5 conjugates (PerCP-Cy5.5, APC-Cy5.5 and Cy5.5) to mouse CD205 was much weaker than that of PE-Cy5.5 (Park et al.).

Þ Potential solution: Given the high specificity of the interaction, you should avoid the use of PE-Cy5.5, and to a lesser extent other Cy5.5 containing fluorochromes, when your cells of interest expresses mouse CD205.

(4) Other effects

Finally, another odd-ball has been reported for APC tandems. Apparently, living cells have some way, which depends on their metabolism, to degrade the APC-Cy7 and APC-H7 tandems, leaving you with an APC signal (Le Roy et al.). APC-Cy7 seemed to be more affected than APC-H7 and monocytes are more active at degrading this signal than lymphocytes.

Þ Potential solution: Given that this requires live cells, fixation of your cell solution after staining will solve this problem. Alternatively, as this degradation requires metabolically active cells, storing your cell solution at 4°C or on ice or adding sodium azide (NaN3) to your storing buffer will reduce the effect.

That’s all I have for now, but if you know of other such ‘pseudo-artifacts’, or if you have any corrections and comments please share them with us!


//


References:

An amazing source for odd questions on flow cytometry is the ‘Cytometry mailing list’ hosted by the Purdue University, which can be found under: https://lists.purdue.edu/mailman/listinfo/cytometry

Beavis, A.J. & Pennline, K.J., 1996. Allo-7: a new fluorescent tandem dye for use in flow cytometry. Cytometry, 24(4), pp.390–395.

Hulspas, R. et al., 2009. Considerations for the control of background fluorescence in clinical flow cytometry. Cytometry, 76B(6), pp.355–364.

Jahrsdörfer, B., Blackwell, S.E. & Weiner, G.J., 2005. Phosphorothyoate oligodeoxynucleotides block nonspecific binding of Cy5 conjugates to monocytes,

Le Roy, C. et al., 2009. Flow cytometry APC-tandem dyes are degraded through a cell-dependent mechanism. Cytometry A, 75(10), pp.882–890.

Pape, K.A. et al., 2011. Different B cell populations mediate early and late memory during an endogenous immune response. Science, 331(6021), pp.1203–1207.

Park, C.G., Rodriguez, A. & Steinman, R.M., 2012. PE-Cy5.5 conjugates bind to the cells expressing mouse DEC205/CD205. J Immunol Methods, 384(1-2), pp.184–190.

Shapiro, H.M., 2004. Practical Flow Cytometry 4th Edt,

Stewart, C.C. & Stewart, S.J., 2001. Cell preparation for the identification of leukocytes. Methods Cell Biol, 63, pp.217–251.

Takizawa, F., Kinet, J.P. & Adamczewski, M., 1993. Binding of phycoerythrin and its conjugates to murine low affinity receptors for immunoglobulin G. Journal of Immunological Methods, 162(2), pp.269–272.

van Vugt, M.J., van den Herik-Oudijk, I.E. & van de Winkle, J.G., 1996. Binding of PE-CY5 conjugates to the human high-affinity receptor for IgG (CD64). Blood, 88(6), pp.2358–2361.

Wu, C.J. et al., 1991. Murine memory B cells are multi-isotype expressors. Immunology, 72(1), pp.48–55.

Zeng, X. et al., 2012. gd T Cells Recognize a Microbial Encoded B Cell Antigen to Initiate a Rapid Antigen-Specific Interleukin-17 Response. Immunity, 37(3), pp.524–534.


Gerhard WingenderGerhard Wingender is currently an Instructor at the La Jolla Institute for Allergy and Immunology (La Jolla, CA). His main lab toy is flow cytometry and his research interest involve invariant Natural Killer T (iNKT) cells.


//


Photo credit: PNNL – Pacific Northwest National Laboratory / Foter.com / CC BY-NC-SA

Markers and functions of human CD4+ follicular helper T cells

human white blood cellCXCR5 is a chemokine receptor expressed by and used to identity human CD4+ follicular helper T cells (TFH).  TFH cells, as their name implies, promote the differentiation and survival of memory and plasma B cells in the B cell follicular and germinal center regions of secondary lymphoid organs. CXCR5+ TFH-like central memory CD4+ T cells (CD4+ TCM) also circulate in peripheral blood and can be detected among human peripheral blood mononuclear cells (PBMC).  CXCR5+ cells comprise 20-25% of CD4+ TCM cells in human PBMC.  However, what are the identifying markers and functional differences of CXCR5+ vs. CXCR5 CD4+ T cells from human PBMC and the prototypical CXCR5+ TFH cells in secondary lymphoid organs?

I have previously discussed markers that can be used for identification of human CD4+ TH1, TH2, and TH17 T cell helper subsets as well as CD4+ FoxP3+ regulatory T cells.  CXCR5 can be upregulated transiently on activated T cells, however a subset of PBMC T cells constitutively express CXCR5, indicating this is a uniquely functioning subset identifiable by this marker using flow cytometry or other methods.  PBMC CXCR5+ CD4+ TCM cells exhibit many but not all features of TFH cells present in secondary lymphoid organs, and thus may be the circulating memory counterpart of TFH cells.

CXCL13, the chemokine ligand for CXCR5, is highly expressed in B cell follicles and likely plays an important role in recruitment of CXCR5+ TFH cells to B cell zones.  Expression of ICOS by TFH cells has been demonstrated to be essential for their function in B cell help.  Additionally, TFH cells are higher expressers of CXCL13, as well as IL-21, IL-10, Bcl-6, and PD-1 than other helper T cell subsets.

Studies by Chevalier et al, and Morita et. al. compared the functional properties of CXCR5 and CXCR5+ CD4+ TCM cells from human PBMC.  PBMC CXCR5+ CD4+ cells are resting central memory cells in phenotype, being CD45RA, CCR7+ and CD62L+, but not expressing activated TFH markers such as ICOS and CD69.  Upon stimulation, CXCR5+ CD4+ TCM promote significantly higher B cell plasmablast differentiation and Ig secretion than CXCR5 CD4+ TCM cells, attributable to enhanced expression of ICOS and IL-10.  However, Bcl-6 expression was not found to be different between these PBMC subsets, and conclusions for expression levels and role of IL-21 were contradictory between these studies.

The question of whether PBMC CXCR5+ CD4+ TCM are distinct from TH1, TH2, and TH17 T cells was addressed by these studies as well. While Chevalier et al. found that CXCR5+ TCM cells were more non-polarized and secreted comparatively lower levels of cytokines associated with TH1, TH2, and TH17 T cells, Morita et. al, identified TH1, TH2, and TH17 T cells within CXCR5+ compartment, albeit at somewhat different frequencies than CXCR5 cells. Thus PBMC CXCR5+ CD4+ TCM are a heterogenous subset with features of both TFH cells and the various TH1, TH2, and TH17 subsets.  Further interrogation of the functions of these populations are needed.

PBMC CXCR5+ CD4+ cells have been identified as a highly relevant population to study in the context of vaccination and human disease.  Patients with systemic lupus erythematosus (SLE) have higher percentages of circulating CD4+CXCR5+ ICOS+ cells.  Patients with autoimmune juvenile dermatomyositis (JDM) were found to have an altered CXCR5+ compartment where the overall frequency of CXCR5+ cells was not different, but the ratio of TH2 and TH17 to TH1 cells within the CXCR5+ population was enhanced and associated with disease activity.

In the vaccine setting, emergence of a population of circulating ICOS+CXCR3+CXCR5+CD4+ T cells was found in individuals 7 days after influenza vaccination, and correlated with increased antibody titers and B cell plasmablasts. These cells could also induce plasma cell differentiation in vitro and  thus are important in the development of vaccine elicited protective antibody responses.

In conclusion, PBMC CXCR5+ CD4+ T cells are an important cellular subset to study in the context of human disease.  These cells are likely the circulating memory component of TFH cells, and alterations in frequencies and functions are associated with various human diseases and protective antibody responses following vaccination.


Further Reading:

Human blood CXCR5(+)CD4(+) T cells are counterparts of T follicular cells and contain specific subsets that differentially support antibody secretion.  Morita R, Schmitt N, Bentebibel SE, Ranganathan R, Bourdery L, Zurawski G, Foucat E, Dullaers M, Oh S, Sabzghabaei N, Lavecchio EM, Punaro M, Pascual V, Banchereau J, Ueno H. Immunity. 2011 Jan 28;34(1):108-21.

CXCR5 expressing human central memory CD4 T cells and their relevance for humoral immune responses.  Chevalier N, Jarrossay D, Ho E, Avery DT, Ma CS, Yu D, Sallusto F, Tangye SG, Mackay CR. J Immunol. 2011 May 15;186(10):5556-68.

Expansion of circulating T cells resembling follicular helper T cells is a fixed phenotype that identifies a subset of severe systemic lupus erythematosus. N. Simpson, P.A. Gatenby, A. Wilson, S. Malik, D.A. Fulcher, S.G. Tangye, H. Manku, T.J. Vyse, G. Roncador, G.A. Huttley et al.  Arthritis Rheum., 62 (2010), pp. 234–244.

Induction of ICOS+CXCR3+CXCR5+ TH Cells Correlates with Antibody Responses to Influenza Vaccination.  Bentebibel S. E. et al.  Sci Transl Med. 13 March 2013: Vol. 5, Issue 176, p. 176ra32.

Photo credit: wellcome images / Foter.com / CC BY-NC-ND

Artifacts and non-specific staining in flow cytometry, Part I

If you add your antibody, lets say anti-CD3-epsilon antibody, to your cell solution you’d expect that only T cells will be labeled, right? Well, if it were so easy then it wouldn’t be biology!


antibodiesIn this first half of the two part blog, I will talk about the two reasons, namely unspecific binding and Fc-receptors, which most people think of when they talk about non-specific binding in flow cytometry.

Some lesser known, but intriguing and important, ‘pseudo-artifacts’ will be covered later in Part II of the blog.


(1) Unspecific binding

Unspecific binding is defined as any sticking of an antibody or a fluorochrome to a cell in a fashion that does not require a specifically (currently) defined interaction. This might occur due to electrostatic interactions, glycolipid interaction on the cell membrane, protein-protein interactions and DNA binding.

As such unspecific binding of a cell depends heavily on the surface area (for surface stains) and/or its volume (intracellular staining). For example a cell with twice the size (as seen in the FSC) has 4-times the surface area (SF = 4pi r2) and 8-times the volume (V = 4/3pi r3) and consequently the unspecific binding will be 4 to 8-times higher. So, if you see the whole population shifting a bit in your histogram, you might want to check the scatter of the cells. For example, activated cells start proliferating, which increase their cell size along the way.


Aggravating factors and potential solutions:

Antibody amount: A surplus of antibody can increase the non-specific binding, leading to a reduction in the separation of your positive cells and reducing the signal:noise ratio.

Þ Potential solution: Titrate your antibody. As a starting point, antibodies with the same fluorochrome conjugate can often be used at similar concentrations.

Extracellular matrix/cell content: All cells bind proteins including antibodies to some degree via various interactions

Þ Potential solution: Addition of protein to the wash and staining solutions will cover many of these binding sites. Most staining protocols include BSA or serum (either human or FCS) for this purpose.

Dead cells: Dead cells are notorious for non-specifically binding antibodies and appear very ‘sticky’. This is partially due to DNA, but including DNAse would only partially solve the problem.

Þ Potential solution: A live/dead differentiation should be included, if possible, in every staining. Dead cells cannot be entirely separated just by FSC/SSC characteristics, especially not after fixation. Keep in mind though, that fixation of your cells after staining with e.g. PI or 7AAD will partially permeabilize all your cells, so that PI or 7AAD can leak out of the labeled cells to other cells eventually homogenously staining all your cells. In the case of 7AAD this can be avoided by inclusion of non-fluorescent actinomycin D (Schmid et al.). However, nowadays multiple live/dead discriminating reagents are available that can be fixed, thereby stopping potential leakage and avoiding this problem altogether.


(2) Binding of antibodies to Fc-receptors:

Obviously Fc-receptors (FcR) bind antibodies with high specificity, but the common misconception is that this is solely species-specific. However, FcRs from one species readily bind antibodies from other species to varying degrees. For example, hamster anti-mouse CD3-epsilon (clone 145.2C11) can bind to all mouse FcRs (Wingender et al.).

Þ Potential solution:

(a)   Fab or F(ab)2 fragments: Utilizing antibodies without their Fc-end avoids the problem altogether, but most commercially available antibodies do contain their Fc part.

(b)   ‘Fc-Block’: Adding antibodies that are specific for particular FcRs that block the undesired interaction with your experimental antibody. However, the ‘Fc-block’ commonly used for mice is the blocking monoclonal antibody 2.4G2 (rat IgG2b kappa) which is specific for mouse Fc-gamma-RII  (CD16) and Fc-gamma-RIII (CD32). Therefore, other FcRs are not directly blocked by 2.4G2. However, the majority of commercial antibodies are of an IgG subtype, most of the potential unspecific Fc-binding will be blocked by 2.4G2. Similar products for staining of human cells are widely available.

(c)     Unconjugated antibody: Adding unconjugated antibody of the same species and isotype as your experimental antibody to your staining cocktail will saturate most potential FcR binding sites.

As a positive side effect, adding unconjugated antibodies, either 2.4G2 or any other isotype, to your stain will incidentally also saturate most other potential unspecific bindings, as they were outlined under (1). Therefore, adding unconjugated antibody to your surface and also your intracellular staining cocktails will reduce unspecific binding.


So much for part one. As always, corrections and comments are highly welcomed.


References:

Schmid, I. et al., 2001. Simultaneous flow cytometric measurement of viability and lymphocyte subset proliferation. J Immunol Methods, 247(1-2), pp.175–186.

Wingender, G. et al., 2006. Rapid and preferential distribution of blood-borne alphaCD3epsilonAb to the liver is followed by local stimulation of T cells and natural killer T cells. Immunology, 117(1), pp.117–126.


//


Gerhard WingenderGerhard Wingender is currently an Instructor at the La Jolla Institute for Allergy and Immunology (La Jolla, CA). His main lab toy is flow cytometry and his research interest involve invariant Natural Killer T (iNKT) cells.


//


References:

Schmid, I. et al., 2001. Simultaneous flow cytometric measurement of viability and lymphocyte subset proliferation. J Immunol Methods, 247(1-2), pp.175–186.

Wingender, G. et al., 2006. Rapid and preferential distribution of blood-borne alphaCD3epsilonAb to the liver is followed by local stimulation of T cells and natural killer T cells. Immunology, 117(1), pp.117–126.


Photo credit: AJC1 / Foter.com / CC BY-NC-SA

The Fascinating System of Eye-induced Immune Regulation

The immune privilege of the eye is a widely recognized but frequently oversimplified concept. The notion that the eye possessed unusual immunological characteristics was recognized in the 19th century by van Dooremaal, who observed prolonged survival of murine skin grafts transplanted into the anterior chamber (AC) of the dog eye. The term ocular ‘immune privilege’ was articulated by Medawar, who recognized that the extended survival of foreign grafts in the AC was a remarkable departure from the fate of similar grafts transplanted to sites outside of the eye. Almost 30 years later, the seminal studies of Kaplan et al. demonstrated that alloantigenic cells introduced into the AC in fact did escape from the eye and induced a deviant immune response in which serum alloantibodies were generated, while systemic cell-mediated immune responses were suppressed in an antigen-specific manner. Subsequent studies in mice confirmed this AC-associated immune deviation (ACAID) and demonstrated that it is an important contributor to the immune privilege of the eye.

ACAID

Figure 1. Organ systems involved in the induction of ACAID.
A brief description of the complex cellular-interplay, that causes ACAID (From Jerry Niederkorn’s review in Nature Immunology 7, 354 – 359;2006). Removal of the thymus, eye or spleen within 72 h of injection of antigen into the anterior chamber prevents the induction of ACAID. Chemical sympathectomy before anterior chamber injection of antigen also prevents the induction of ACAID. IL-, interleukin; BCR, B cell receptor. 


Several labs have since confirmed that antigens introduced into the AC elicit a deviant immune response, which is characterized by the antigen-specific suppression of classical Th1 immune responses, such as delayed-type hypersensitivity (DTH) and complement-fixing antibodies, while preserving the generation of noncomplement-fixing antibodies of the IgG1 isotype in the mouse. This complex phenomenon called ACAID involves multiple cell types that interact to create unique, antigen-specific immune suppression. Briefly, the injection of antigen into the ocular AC results in the antigen being taken up by circulating F4/80+ cells (a type of dendritic cell) that migrate to the spleen and thymus. Within 3 days of entering the thymus,  the F4/80+ cells induce the generation of CD4-CD8-NK1.1+ thymocytes that are believed to enter the circulation as recent thymic emigrants and home to the spleen, where they contribute to the generation of splenic regulatory cells. The spleen is the terminal organ in ACAID, where there is a complex interaction between the F4/80+ cells, natural killer T (NKT) cells, NK1.1 cell, gamma delta T cells and B cells, which in turn elicit the generation of CD4+ and CD8+ regulatory T cells (T regs) specific for the antigen that was introduced in the AC. These T regs are the key players in causing the antigen specific immune-suppression. That ACAID may occur in humans is suggested by the demonstration that individuals with acute retinal necrosis develop antibodies but not cell-mediated immunity to Varicella zoster.

Because the injection of antigen into the AC induces different phenotypes of Tregs and classically Tregs have been known to suppress autoimmunity, Bhowmick et al in 2011 investigated the ability of splenic regulatory T cells induced by an intracameral injection of MOG35-55 peptide to regulate MOG35-55-induced EAE (Experimental Autoimmune Encephalomyelitis), the animal model of human Multiple Sclerosis. In this animal model, MOG35-55 immunization results in an immune response against MOG35-55 peptide which is a component of the Myelin protein, hence causing an inflammatory auto-reaction against myelin and neurodegeneration, similar to the human disease – Multiple Sclerosis. Bhowmick et al found that the injection of MOG35-55 peptide into the ocular AC could suppress MOG35-55 peptide induced EAE, both as a cure (when injected after disease initiation) and as a prophylactic measure (when injected prior to disease induction). The suppression was antigen specific because when they injected an unrelated antigen e.g ovalbumin into the AC, it did not affect EAE in the recipient animal.

They next went on to isolate the AC-injection-induced splenic regulatory T cells and via elegant adoptive transfer experiments showed that AC-induced CD4+ regulatory T cells could suppress the diseases ONLY at the early stage (also known as the priming phase of the disease). While AC-induced CD8+ regulatory T cells could only suppress the progression of an already initiated diseases (known as the chronic phase of EAE). The CD8s were ineffective at the effector phase and vice versa. This was probably the first report which differentiated between the priming and chronic phase of EAE and showed that effective suppression of autoimmune response in EAE can be achieved by different regulatory T cell populations. This work also revealed that while the suppression of EAE by AC-induced CD8+ regulatory T cells is TGF-β dependent, the AC-induced CD4 T regs, do not use TGF-β.

Characteristically, previous studies have shown that ACAID-CD4 Treg cells do not express FoxP3. And the induction of and the activity of regulatory T cells in ACAID is independent of CD4+FoxP3+ regulatory T cells. AC-induced CD8+ regulatory cells suppress IFN-γ production in vitro and in vivo suppress T cells that effect a DTH reaction in immunized mice. Further, AC-induced CD8+ regulatory cells are restricted by Qa-1 antigens expressed by effector T cells. Since the non-classical MHC class I molecule Qa-1 is known to be expressed only on activated cells, AC-induced CD8+ regulatory T cells specifically suppress activated T cells and hence the effector or chronic phase of an autoimmune disease like EAE. Thus it can be concluded that ACAID suppresses the induction of effector T cells and also the activity of effector T cells by distinct populations of regulatory T cells. Recently it was shown that Type II collagen (CII), a key antigen involved in auto-immune responses during Rheumatoid Arthritis, could induce a similar CII-specific immune suppression via ACAID (Farooq et al 2012). A finding that has opened up possibilities of using this system in an Arthritis model to test its efficacy.

Overall these data indicate that the suppression of an ongoing autoimmune disease by the adoptive transfer of regulatory T cells might only be feasible when the regulatory T cells are specific for the pathogenic antigen. Alternatively, transfer of polyclonal regulatory T cells may cure ongoing disease only in lymphopenic hosts, in which the massive expansion of regulatory T cells may lead to the generation of a sufficient number of antigen-specific regulatory T cells. If this is also the case also in humans, it may represent a significant limitation for the clinical application of regulatory T cells in autoimmune diseases, as, to date, human self-antigen specific regulatory T cells have not been successfully expanded ex vivo. In this regard, the use of Anterior Chamber Associated Immune Deviation (ACAID), can be highly effective as ACAID can generate antigen-specific CD8+ and also CD4+ regulatory T cells.


Arijit BhowmickArijit Bhowmick is currently a postdoctoral researcher at the Immunology institute of the Mount Sinai Medical Center, NY. He received his PhD in structural immunology from the National Institute of Immunology, New Delhi. His current research interests encompass autoimmunity, Th17 cells and structure based inhibitor designing. 


Understanding MFI in the context of FACS data

Understanding MFI in the context of FACS data

The speed, sensitivity and versatility of flow cytometry are things of beauty, but with great power comes great responsibility. The fact is that with potentially millions of data points accrued over the run of a single sample, finding the best way to compare those data can be daunting. One of the more commonly misunderstood and often misleading tools in FACS analysis is a pesky little statistic — MFI.


What is MFI?

mean mode median MFI
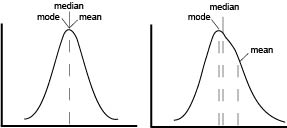
The first point of confusion is born from the name itself. MFI is often used without explanation, to abbreviate either arithmetic mean, geometric mean, or median fluorescence intensity. In a perfect world, our data would be normally distributed and in that case means, median and mode are all equal. In reality, flow data is rarely normal and never perfect. The more that the data skews, the further the mean drifts in the direction of skew and becomes less representative of the data being analyze as seen on the graphical representation.

Because fluorescent intensity increases logarithmically, arithmetic mean quickly becomes useless to generalize a population of events, as a right-hand skew causes even more exaggeration of the mean. To combat this, geometric mean (gMFI) is often used to account for the log-normal behavior of flow data, however, even gMFI is susceptible to significant shifts. This leaves us with the median or the mid-point of the population. Median is considered a much more robust statistic in that it is less influenced by skew or outliers. Is there a “right” MFI to use to analyze flow data? No. But generally speaking, median is the safest choice and usually most representative of a “typical” cell.


Three common mistakes when using MFI

            Characterizing a bi-modal population: Any average only holds true for normal distributions, and a bi-modal population is by definition not normal. Statistics aside, gating each population and presenting percentages will yield data that is both more easily interpretable as well as more statistically significant.

            Comparing data from disparate experiments: Because fluorescent intensity is sensitive to experimental condition (e.g. antibody dilution, tandem dye degradation, laser fluctuations, etc.), it is dangerous to compare intensity of any kind across multiple experiments.

            Blindly using MFI as a quantification of expression: While FACS is more than sensitive enough to provide estimates of ligand abundance, such calculations require normalization and calibration using a standard curve. Additionally, it is tempting to say that a population with a higher MFI has higher expression than one with a lower MFI, however, care must be taken to ensure other factors are not responsible. For example, a large cell with more membrane and consequently more surface protein, can appear brighter than a smaller cell of the same type. Thus, it is important to control carefully for things such as size or compensation that may confound results.


So, when should I use MFI?

Not until asked by a reviewer.

Kidding.

MFI has many important uses, but can sometimes be as much a distraction from the data as it is a clarification. Ultimately, like any piece of data, MFI should only be applied if you are absolutely certain that it is the best comparison to make, otherwise it is simply clutter on an otherwise clean histogram.


For further reading:

Flowjo’s excellent explanation of the differences between mean, median and mode. http://flowjo.typepad.com/the_daily_dongle/2007/10/mean-median-mod.html

An amazing article explaining when and why to use bi-exponential axes. Importantly, the affect scaling can have on actually visualizing the median value of a population.

http://facs.scripps.edu/ni0706-681.pdf


adam bestAdam Best is currently a post-doctoral fellow at the University of California, San Diego where he also received his Ph.D. in Biomedical Sciences. His research focuses on understanding the transcriptional events that govern the formation of memory T cells


Natural Killer Cell subtypes and markers in human PBMC

Natural killer cells
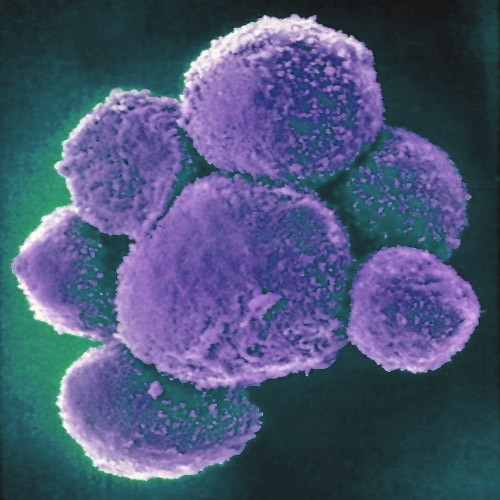
Natural Killer (NK) cells are a cytotoxic innate immune lymphocyte cell type.  In humans, NK cells comprise up to 15% of peripheral blood mononuclear cells (PBMC), and 5-20% of the PBMC lymphocyte population.  Several subtypes of NK cells exist in humans.  In this post, I will discuss phenotypic properties and markers of NK subtypes present in human PBMC.

Three subtypes of NK cells are recognized: CD56dim CD16+, CD56brightCD16+/- and CD56 CD16+ NK cells. The CD56dim CD16+ and CD56brightCD16+/- subsets are best studied and are phenotypically classified as a more cytotoxic and a more cytokine producing subset of NK cells, respectively.  NK cell activation is mediated by the balance between engagement of activating receptors including NKp46, NKp30, NKp44, NKG2D, CD16, 2B4, NKp80, and DNAM-1, and HLA-I binding inhibitory receptors including killer immunoglobulin-like receptors (KIRs), LIR1/ILT2 and NKG2A/CD94.  NK cells can also be activated in response to cytokines such as IL-2, IL-12, IL-15, and IL-18.

CD56dim CD16+ NK cells:  This subtype comprises the majority, up to 90%, of PBMC NK cells and is considered the most cytotoxic subset.  CD16 is the FCγ receptor III, and can thus bind the FC portion of IgG antibodies and mediate antibody dependant cell-mediated cytotoxicity (ADCC) of antibody-bound target cells.  Expression of inhibitory receptors differs among NK subsets, and this subset exhibits lower expression of KIRs and ILT2 but higher expression of NKG2A/CD94 compared with CD56bright NK cells. Expression of granzyme B and perforin is also high in this subset compared with CD56bright NK cells.  A recent report by De Maria et. al, demonstrated that this subset does in fact robustly produce cytokines including IFNγ early after activation.

CD56brightCD16+/- NK cells: This subtype comprises up to 10% of NK cells in PBMC, but is the major NK subtype in tissues and secondary lymphoid organs.  This subset is conventionally known as the cytokine producing subset of NK cells, and rapidly produces cytokines and chemokines including IFNγ, TNFα, GM-CSF, and RANTES after activation.

Interestingly, in HIV-viremic individuals, a third CD56 CD16+ NK population is significantly expanded in PBMC comprising between 20-55% of NK cells.  This population in healthy individuals and aviremic HIV-infected individuals is rare, under 10% of total NK cells.  Compared with CD56+ NK cells, the CD56 CD16+ NK cells from HIV-viremic patients exhibited lower expression of activating receptors NKp46, NKp30, and NKp44, lower cytotoxic activity, higher expression levels of inhibitory receptors, and lower expression levels of cytokines including IFNγ, TNFα, and GM-CSF.  This subset is also expanded in individuals with chronic HCV infection.  Thus, the expansion of this poorly functional NK subset is likely clinically relevant in chronic viral disease.

In summary, these NK populations can be differentiated by expression of CD16 and CD56.  Of note, NKT (natural killer-like T) cells can also express these markers along with CD3.  Thus, to differentiate these cells from NKT cells, the inclusion of CD3 as a cell identification marker is critical in analysis of these cells by flow cytometry or other methods.


Further Reading:

CD56 negative NK cells: origin, function, and role in chronic viral disease.  Björkström NK, Ljunggren HG, Sandberg JK. Trends Immunol. 2010 Nov;31(11):401-6.

The biology of human natural killer-cell subsets. Cooper MA, Fehniger TA, Caligiuri MA. (2001) Trends Immunol 22: 633–640.

Natural killer cell distribution and trafficking in human tissues.  Carrega P, Ferlazzo G. Front Immunol. 2012;3:347.

Revisiting human natural killer cell subset function revealed cytolytic CD56(dim)CD16+ NK cells as rapid producers of abundant IFN-gamma on activation.  De Maria A, Bozzano F, Cantoni C, Moretta L. Proc Natl Acad Sci U S A. 2011 Jan 11;108(2):728-32.

Natural killer cells in HIV-1 infection: dichotomous effects of viremia on inhibitory and activating receptors and their functional correlates.  Mavilio D, Benjamin J, Daucher M, Lombardo G, Kottilil S, Planta MA, Marcenaro E, Bottino C, Moretta L, Moretta A, Fauci AS. Proc Natl Acad Sci U S A. 2003 Dec 9;100(25):15011-6.

Characterization of CD56−/CD16+ natural killer (NK) cells: a highly dysfunctional NK subset expanded in HIV-infected viremic individuals. Mavilio D, Lombardo G, Benjamin J, Kim D, Follman D, et al.. (2005) Proc Natl Acad Sci U S A. 102: 2886–2891.

Generation of CD4+ Th1 cells from human PBMC

CD4+ T helper type 1 (TH1) cells are the effector T cell population that governs cell mediated immune responses against intracellular pathogens including viruses and intracellular bacteria.  TH1 cells mediate their effect by secreting cytokines such as interferon-gamma (IFNγ) and IL-2, and express cell surface markers including CXCR3 and CCR5 and the characteristic TH1 master transcription factor T-bet (TBX21) which can also be used for detection of TH1cells by flow cytometry, as discussed in a previous blog post.

Differentiation of naïve human CD4+ T cells down the TH1 pathway involves cytokines such as IL-12 which activates STAT4, and induces expression of IFNγ and T-bet.  As such, in vitro protocols differentiating peripheral blood mononuclear cells (PBMC)-derived naïve CD4+ T cells into TH1 cells involves incubation with IL-12 in the context of T cell activation through the T cell receptor (TCR) complex.

In my experience, TH1 cells are by far the easiest CD4+ helper T cell population to generate in vitro.  In order to generate TH1 cells from human PBMC, naïve CD4+ T cells must first be isolated.  Multiple methods of naïve CD4+ T cell isolation can be utilized, and magnetic bead- based methods are common and easy methods.  Companies such as Miltenyi Biotech and Stem Cell Technologies offer kits for isolation of untouched naïve CD4+ T cells from PBMC by negative isolation methodologies.

Following isolation, naïve CD4+ T cells are activated through the TCR complex.  Tissue culture plates can be coated with anti-CD3 (OKT1) and anti-CD28 antibodies in PBS prior to culture.  Alternatively, naïve CD4+ T cells can be cultured with Dynal CD3/CD28 T Cell Expander Dynabeads (Life Technologies) at a 1 bead per cell ratio.  A third alternative involves coating tissue culture plates with anti-CD3 alone and obtaining CD28 co-stimulation by the addition of autologous monocytes isolated from PBMCs into the culture.

To generate TH1 cells, recombinant human IL-12 is added alone, or at a lower dose in combination with anti-IL-4 blocking antibodies to inhibit the counteractive effects of IL-4 and TH2 pathways on TH1 cell polarization.  Finally recombinant human IL-2 is added to promote T cell proliferation.  Media and cytokines/blocking antibodies are refreshed every two to three days depending on the cell density, and as the cells expand the time to refresh the media shortens.

Lymphocyte activation
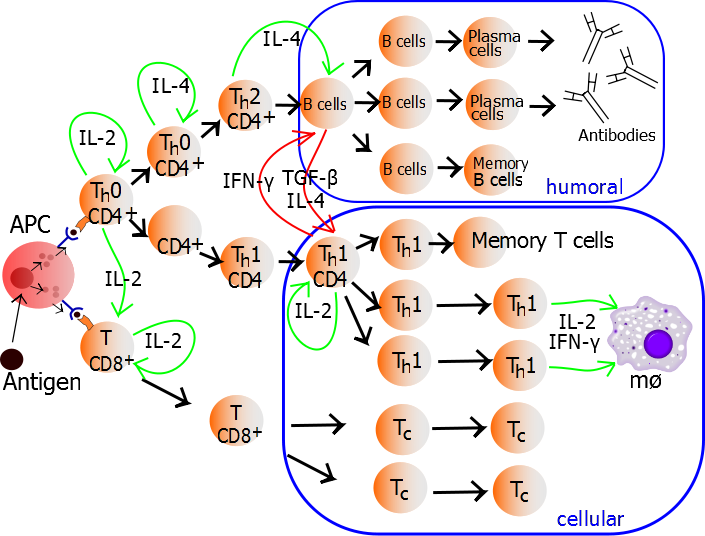
TH1 cells can be generated and assayed for functions including IFNγ expression in as few as three days.  If long term or clonal T cells assays are of interest, cells can be expanded in the presence of IL-2 for 2-3 weeks following single cell cloning.  As previously discussed, TH1 cells can be identified by IFNγ expression following a 4-6 hour incubation with TCR activation by plate bound anti-CD3 plus anti-CD28, CD3/CD28 Dynabeads, or PMA/ionomycin in the presence of brefeldin-A.  Cells are then fixed, permeabilized, and stained for cell surface markers and intracellular IFNγ.

Finally, as a comparison, tandem experiments can be run in which naïve CD4+ T cells are maintained under non-polarizing (TH0) conditions.  For this, often no cytokines aside from IL-2 are added.  However the addition of anti-IL-12 and anti-IL-4 may be necessary to inhibit any cells from differentiating down TH1 or TH2 pathways by production of these cytokines by the T cells themselves.

In conclusion, generation of CD4+ TH1cells from human PBMC is a relatively simple and straightforward protocol, and very high percentages of TH1cells can be obtained through optimized protocols.


Further Reading:

Differentiation of effector CD4 T cell populations (*).  Zhu J, Yamane H, Paul WE.  Annu Rev Immunol. 2010;28:445-89.

Memory and flexibility of cytokine gene expression as separable properties of human T(H)1 and T(H)2 lymphocytes.  Messi M, Giacchetto I, Nagata K, Lanzavecchia A, Natoli G, Sallusto F.  Nat Immunol. 2003 Jan;4(1):78-86.

A critical function for transforming growth factor-beta, interleukin 23 and proinflammatory cytokines in driving and modulating human T(H)-17 responses.  Volpe E, Servant N, Zollinger R, Bogiatzi SI, Hupé P, Barillot E, Soumelis V. Nat Immunol. 2008 Jun;9(6):650-7.

Identification of CD8+ TC1, TC2, and TC17 populations in human PBMC

Human peripheral blood mononuclear cells (PBMC) are composed of heterogeneous populations of various immune cell types.  CD4+ and CD8+ T cells are known to exist in various functional and differentiated states.  Following antigen experience, naïve T cells are thought to progressively differentiate along a path through central memory, effector memory, and terminally differentiated effector states. Markers for differentiating PBMC T cells into these subtypes using multiparametric flow cytometry include: CD3, CD4, CD8, CD45RA or CD45RO, and CCR7 or CD62L.

The cytokine milieu T cells are exposed to during antigen encounter directs differentiation into various subtypes that exhibit unique functional properties and gene expression programs including cytokines, transcription factors, and surface markers.  This is true for both CD4+ and CD8+ T cells. In a previous post, I discussed various markers that can be utilized by flow cytometry to identify CD4+ TH1, TH2, and TH17 populations in human PBMC.

CD8+ T cells can also differentiate into unique subsets similar to TH1, TH2, and TH17 CD4+ T cells.  The CD8+ versions of these subsets are referred to as TC1, TC2, and TC17 CD8+ T cells, respectively, and are defined by expression of the same characteristic cytokines as their CD4+ counterparts.

As previously discussed, expression of subset-specific surface markers is easily determined by flow cytometry. Identification of intracellular cytokine production in T cells can be assessed following 4-6 hours of TCR stimulation with anti-CD3 and anti-CD28 antibodies or the combination of Phorbol 12-Myristate 13-Acetate (PMA) and ionomycin in the presence of brefeldin A or monensin.  The cells are then fixed and permeabilized with buffers such as BD Biosciences’ Cytofix Cytoperm buffer set followed by antibody staining for cytokine expression and flow cytometry.

Like CD4+ TH1 cells, CD8+ TC1 cells characteristically produce IFNγ.  This population is by far the most common cytokine-producing CD8+ cell subset, and is very easy to identify using intracellular staining for IFNγ.

As with CD4+ TH2 cells, CD8+ TC2 cells can be identified by expression of IL-4, IL-5, and IL-13Cosmi et. al, found that the surface marker CRTH2 was a robust marker for identification of CD8+ and CD4+ cells producing IL-4, IL-5, and IL-13 expression but not IFNγ.  Expression of chemokine receptors CCR3 and CCR4 however, did not exclude IFNγ-producing cells.  Because expression of IL-4, IL-5, and IL-13 can be difficult to detect, CRTH2 may be the easiest of these markers for TC2 identification in human PBMC.

CD8+ TC17 cells are characterized by expression of the cytokine IL-17.  Expression of the chemokine receptors CCR5 and CCR6 were shown to enrich for IL-17 producing CD8+ cells.  However CCR5 and CCR6 expression are also associated with TC1 cells, and thus may not be useful to differentiate between these subsets.

CD8 Tc1 Tc2 Tc17 PMA resized 600

Figure: Expression of IFNγ, IL-17, and CRTH2 in CD8+ T cells from PBMC stimulated with for 4 hours with PMA/ionomycin.

In my own studies, I have utilized TCR or PMA/ionomycin stimulation of PBMCs to successfully identify IFNγ (TC1) and IL-17 (TC17) expressing cells, and CRTH2 expression to identify TC2 cells, as these may be the most robust markers for identification of these unique CD8+ T cell populations. Note also that these same markers reliably detect CD4+ TH1, TH17, and TH2 cells, respectively. Thus, these markers are useful to quantitate and study the function of both CD8+ and CD4+ subsets in human PBMC.


Additional Reading

Generation of polarized antigen-specific CD8 effector populations: reciprocal action of interleukin (IL)-4 and IL-12 in promoting type 2 versus type 1 cytokine profiles.  Croft M, Carter L, Swain SL, Dutton RW. J Exp Med. 1994 Nov 1;180(5):1715-28.

CRTH2 is the most reliable marker for the detection of circulating human type 2 Th and type 2 T cytotoxic cells in health and disease.  Cosmi L, Annunziato F, Galli MIG, Maggi RME, Nagata K, Romagnani S.  Eur J Immunol. 2000 Oct;30(10):2972-9.

Cutting edge: Phenotypic characterization and differentiation of human CD8+ T cells producing IL-17.  Kondo T, Takata H, Matsuki F, Takiguchi M. J Immunol. 2009 Feb 15;182(4):1794-8.

Functional expression of chemokine receptor CCR6 on human effector memory CD8+ T cells.  Kondo T, Takata H, Takiguchi M. Eur J Immunol. 2007 Jan;37(1):54-65.

Maturing and Assaying Monocyte-Derived Dendritic Cells

Generating dendritic cells (DCs) from PBMC CD14+ monocytes allows researchers to do a host of immunological assays. A common example of this is to examine the reactivity of a T cell mixture to a certain antigen of interest. However, prior to doing such antigen presentation assays, DCs must be properly matured in order to fully elicit a T cell response.

After generating your monocyte derived DCs (mDCs) from PBMCs, as I described in my previous post, you will have several choices on how to mature them. Two of the most common choices are to either use LPS or a monocyte maturation cocktail (MMC). LPS binds TLR4, which results in a host of downstream inflammatory genes being upregulated. Addition of IFNγ can polarize the DCs to a Th1 phenotype, while the addition of TNFα can polarize the DCs somewhat towards a Th2 phenotype. MMC, however, usually involves the addition of several molecules including TNFα, IL-6, IL-1β, and PGE2. The overall effect of this pool of molecules is to elicit a mixed Th1 and Th2 response by the DCs. Thus, the maturation method of choice is a critical choice for the researcher and may vary depending on the downstream functional assay.

Interrogating your DCs by flow cytometry is a good idea so you can be sure you have attained the cell phenotype you desire. mDCs will commonly express CD11c and CD1c and should be CD123-. Furthermore, upregulation of costimulatory molecules CD80 and CD86 and the immunoregulatory molecule CD83 and downregulation of CD14 are hallmarks of DC maturation. HLA molecules are also significantly upregulated. Remember, these molecules are not just cell markers, but have important functional relevance. The upregulation of costimulatory molecules is critical for the activation of T cells and the upregulation of surface HLA molecules is a reflection is the enhance antigen presentation capability of a mature DC.Dendritic Cells Dot Plot with CD1c and CD11c Expression

Running your DCs on the flow cytometer will require a few special tweaks on your normal cytometer settings. The first thing you will notice is that the DCs are rather massive and irregular shaped cells. You will therefore likely need to significantly decrease both your forward scatter and side scatter to locate them on your dot plot. Secondly you will want to significantly decrease the voltages for all the channels detecting fluorchromes on your DC activation markers. These activation markers are expressed at such a high level on the DCs, that they are incredibly bright. A third issue is the high level of auto-fluorescence on DCs. It is always a good idea to have some extra DCs you can run while setting up your voltages to make sure your CD marker fluorochromes are all on scale.  Be sure to use the activated sample of DCs for this! Once you have verified your settings will work, you can then proceed to normal compensation set up.

Once your cytometer settings are established your cells are ready to assay. It is a good idea to have a sample of DCs that you did not stimulate as a control to compare your matured DCs to. In my experience the best way to compare markers, such as CD83, CD86, HLA-ABC, and HLA-DR, is by using histogram overlays. Their upregulation can often be a slight shift in fluorescent intensity, which you can readout by graphing Median Fluorescent Intensity (MFI). Of course be sure that you have titered your antibodies appropriately and use isotype controls when you can. Also keep in mind that comparing MFI readouts between different assay days, different stains, and different experiments is virtually impossible. Try to group your assays whenever possible, but if not, fold change in MFI is a useful, though not ideal, calculation for comparing these sorts of data.


Differentiation of Peripheral Blood Monocytes into Dendritic Cells. David W. O’Neill, Nina Bhardwaj. Current Protocols in Immunology. July, 2005.

Improved methods for the generation of dendritic cells from nonproliferating progenitors in human blood. Bender A, Sapp M, Schuler G, Steinman RM, Bhardwaj N.  J Immunol Methods. 1996 Sep 27;196(2):121-35.

Monocyte-derived DC maturation strategies and related pathways: a transcriptional view. Luciano Castiello, Marianna Sabatino,   Ping Jin, Carol Clayberger, Francesco M. Marincola, Alan M. Krensky, David F. Stroncek. Cancer Immunol Immunother. 2011 April; 60(4): 457–466.

Taking dendritic cells into medicine. Steinman RM, Banchereau J. Nature. 2007;449:419–426.

Current approaches in dendritic cell generation and future implications for cancer immunotherapy.  Tuyaerts S, Aerts JL, Corthals J, et al. Cancer Immunol Immunother. 2007;56:1513–1537.

Comparative evaluation of techniques for the manufacturing of dendritic cell-based cancer vaccines.  Dohnal AM, Graffi S, Witt V, et al. J Cell Mol Med. 2009;13:125–135. 


describe the image
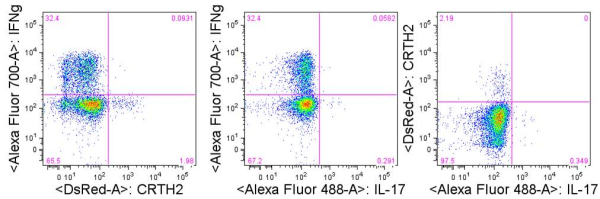
Colt Egelston is currently a post-doctoral fellow at the Beckman Research Institute of the City of Hope, in Duarte, CA. He received his Ph.D. from Rush University in Chicago and is interested in all things immunology.

Defining Human PBMC T cell activation markers. Part 2: CD71 and CD95

In a previous posting, I discussed the use of T cell activation markers as a strategy for assessing the function of T cells from human peripheral blood mononuclear cells (PBMC). Following T cell receptor (TCR) activation, T cells will express a series of activation markers that include chemokine and cytokine receptors, adhesion molecules, co-stimulatory molecules, and MHC-class II proteins. Understanding what these activation markers are, when they are expressed, and their role in T cell function during normal responses and disease states is important when selecting markers for assessing T cell biology for studies on human PBMC.

In the previous posting, I discussed two immediate early activation markers for assessing the activation status of human PBMC T cells: CD69 and CD40L.  In this article, the second in this series, I will discuss two additional mid-early T cell activation markers that can be assessed by flow cytometry: CD71 and CD95.

CD71 (TFRC, Transferrin Receptor, TfR) is a cell surface iron transport receptor that is upregulated in proliferating cells by 24-48 hours following T cell activation and expression continues to rise and is maintained for several days.  Thus CD71 can be considered a mid-early activation marker as compared with late activation markers that are not appreciably upregulated until even later time points.  CD71 has been shown to associate with the TCRz chain and ZAP70 and may participate in TCR signaling, and is an essential factor for proliferating T cells.

The inability of CD71 to be upregulated following TCR activation may be associated with T cell dysfunction.  As was similarly discussed for CD69, Critchley-Thorne et. al, 2007 showed that PBMC T cells from metastatic melanoma patients had reduced CD71 upregulation compared with healthy controls, and this corresponded with multiple other functional defects in T cells from these patients.  Thus CD71 may be aberrantly expressed by T cells in human disease.

fas signaling
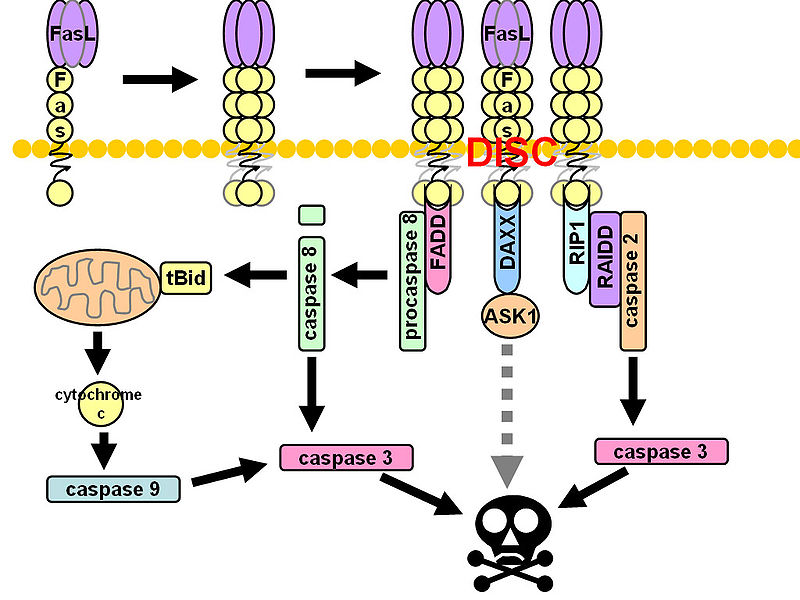
CD95 (Fas, APO-1, TNFRSF6) is a member of the TNF-receptor superfamily and is best known for its role in mediating activation-induced cell death in activated T cells following binding to its ligand, CD95L/FasL induced on antigen-presenting cells (APCs).  However, CD95 can also play additional, non-apoptotic roles in the modulation of T cell function.  CD95 ligation has been shown to inhibit TCR signaling and activation of naïve T cells.  However, this negative co-stimulatory effect appears to be dose-dependent, as low doses of CD95 agonists had the opposite effect and strongly promoted activation and proliferation of T cells.  Like CD71, CD95 expression can be detected by 24 hours following T cell activation and continues to increase over the course of several days.

Due to its differential roles in regulation of T cell apoptosis and activation, dysregulated expression of CD95 or its ligand CD95L could be avenues for T cell dysfunction in various human diseases.  Indeed, Strauss et. al, showed that regulation of CD95L expression may play a role in immune evasion during viral infections. CD95L was upregulated in HIV-infected APCs, and led to suppressed T cell activation.  Interferons are known to enhance CD95 expression, and our group (Critchley-Thorne et. al, 2009) has shown reduced upregulation of CD95 in PBMC T cells from breast cancer patients following T cell activation in the presence of interferons, indicating the lack of full T cell activation under these conditions.

Thus both CD71 and CD95 are upregulated in the mid-early phase of T cell activation and dysfunctional expression may be useful measures of T cell dysfunction in various disease states. Thus, these may be useful markers when assessing the phenotype and function of human PBMCs.


Additional Reading:

Comparative analysis of lymphocyte activation marker expression and cytokine secretion profile in stimulated human peripheral blood mononuclear cell cultures: an in vitro model to monitor cellular immune function.  Reddy M, Eirikis E, Davis C, Davis HM, Prabhakar U. J Immunol Methods. 2004 Oct;293(1-2):127-42.

Multiparametric flow cytometric analysis of the kinetics of surface molecule expression after polyclonal activation of human peripheral blood T lymphocytes. Biselli R, Matricardi PM, D’Amelio R, Fattorossi A. Scand J Immunol. 1992 Apr;35(4):439-47.

Surface markers of lymphocyte activation and markers of cell proliferation.  Shipkova M, Wieland E.  Clin Chim Acta. 2012 Sep 8;413(17-18):1338-49.

Flow cytometric analysis of activation markers on stimulated T cells and their correlation with cell proliferation.  Caruso A, Licenziati S, Corulli M, Canaris AD, De Francesco MA, Fiorentini S, Peroni L, Fallacara F, Dima F, Balsari A, Turano A.   Cytometry. 1997 Jan 1;27(1):71-6.

Transferrin receptor induces tyrosine phosphorylation in T cells and is physically associated with the TCR zeta-chain.  Salmerón A, Borroto A, Fresno M, Crumpton MJ, Ley SC, Alarcón B. J Immunol. 1995 Feb 15;154(4):1675-83.

Transferrin synthesis by inducer T lymphocytes.  Lum JB, Infante AJ, Makker DM, Yang F, Bowman BH. J Clin Invest. 1986 Mar;77(3):841-9.

Down-regulation of the interferon signaling pathway in T lymphocytes from patients with metastatic melanoma.  Critchley-Thorne RJ, Yan N, Nacu S, Weber J, Holmes SP, Lee PP. PLoS Med. 2007 May;4(5):e176.

Pro- and anti-apoptotic CD95 signaling in T cells.  Paulsen M, Janssen O. Cell Commun Signal. 2011 Apr 8;9:7.

CD95 co-stimulation blocks activation of naive T cells by inhibiting T cell receptor signaling.  Strauss G, Lindquist JA, Arhel N, Felder E, Karl S, Haas TL, Fulda S, Walczak H, Kirchhoff F, Debatin KM.  J Exp Med 2009, 206:1379-1393.

Impaired interferon signaling is a common immune defect in human cancer.  Critchley-Thorne RJ, Simons DL, Yan N, Miyahira AK, Dirbas FM, Johnson DL, Swetter SM, Carlson RW, Fisher GA, Koong A, Holmes S, Lee PP. Proc Natl Acad Sci U S A. 2009 Jun 2;106(22):9010-5.

*Image courtesy of http://en.wikipedia.org/wiki/Fas_ligand*